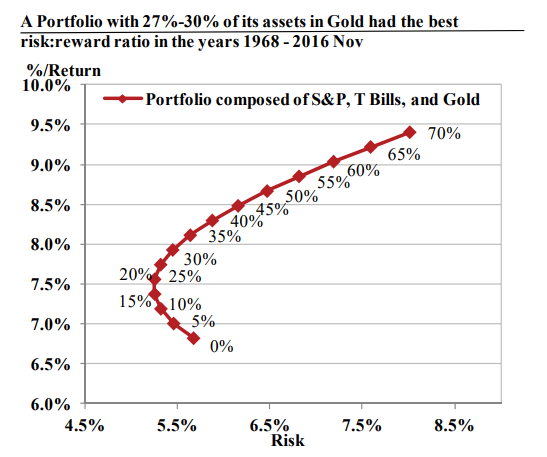
In the early part of the 1980s, there were many seminal gold price studies that showed 5% to 10% of an investment portfolio could have been optimally allocated to gold from 1968 to 1980 to maximize a risk return allocation based on performance. Even today many high profile and alternative financial experts…say a 10% gold allocation makes sense but a closer look at the facts show that they may be a little understated in percentage terms. Let’s take a closer look as to why this may be the case.
For over a decade I have worked and invested in the physical precious metals industry. Throughout this timeframe Jeffrey Christian and the CPM Group have consistently produced sound and accurate research and market projections. They re-ran the numbers in a back-test from about 1968 to late 2016 and what they found was that if you took a portfolio of 50% S&P and 50% T-bills and you added gold to it in 5% increments, the optimal gold allocation was actually about 27% to 30% gold depending on whether you used T-bills or T-bonds respectively.
It should be noted that this 27% to 30% gold allocation does not take real estate investing into account and strictly referred to bonds and equity or stock markets which are, and have been, easily estimated at more than ten times the size of all the physical silver and gold above ground and much less paltry investment allocations to each respective precious metal currently…
[On one hand one can] see the explosive growth in paper asset values to gold investment holdings since 1980 in the following chart.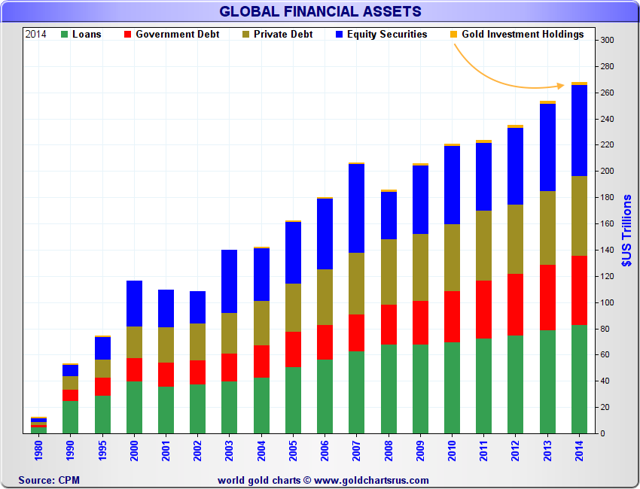
On the other hand, the global supply of fiat monies (M2), in which silver and gold are mostly measured, have grown dramatically loosing some 95% of their purchasing to gold bullion and about 92% of its value to silver bullion since 1973. This trend will most likely not change unless the underlying structure of IMF Special Drawing Rights themselves are changed to include some form of bona fide physical bullion backing aside from its current 5 fiat currency indexing.
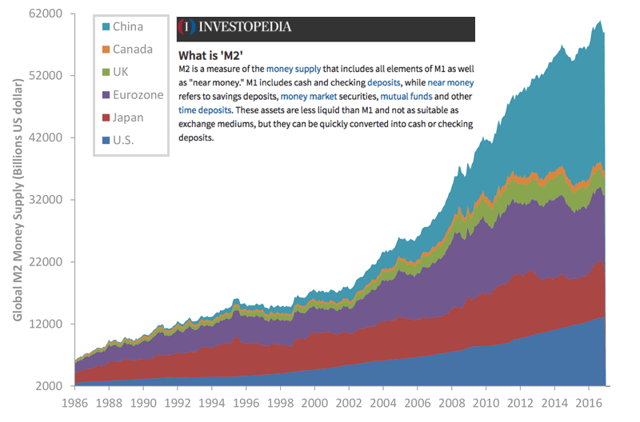
Central Bank M2 Money Supply Chart + M2 Definition
Given the above, as long as we remain under a full fiat currency monetary system, I find it hard believing no physical silver bullion or gold bullion ownership makes prudent sense on a go forward basis.
Indeed, I believe that having a portion of one’s wealth denominated in physical silver and or gold bullion is likely more stable than having an undiversified investment portfolio which often can be subject to severe currency valuation volatility, potential bond bear markets, and eventual stock bear markets which can wreak havoc on one’s investment portfolio if not properly diversified ahead of time.
I personally expect another mania in precious metal prices to ensue as the years progress, somewhat similar – but far larger in scope – than the last late 1970s version.
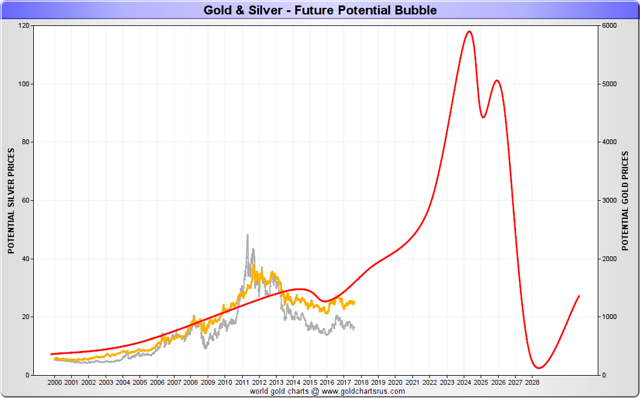
Perhaps now is the time to begin reallocating some capital from equities and other paper assets back into physical precious metals…
The comments above are edited ([ ]) and abridged (…) excerpts from the original article by James Henry Anderson
Thanks for reading! If you want more articles like the one above visit our Facebook page (here) and “Like” any article so you can get future articles automatically delivered to your feed. You can also “Follow the munKNEE” on Twitter or register to receive our FREE tri-weekly newsletter (see sample here , sign up in top right hand corner).
Remember: munKNEE should be in everybody’s inbox and MONEY in everybody’s wallet!