Despite a long list of major risks to the global economy, the trend for the stock  market is still UP until proven otherwise. At this stage it is absolutely critical to be cautious and watch for signs of a market correction or peak, but it is our view that a recession won’t take hold until the following 6 key indicators are triggered.
The above introductory comments are edited excerpts from an article* by chartprophetcapital.com as posted on SeekingAlpha.com under the title How To Predict The Next Recession.
The following article is presented courtesy of Lorimer Wilson, editor of www.munKNEE.com (Your Key to Making Money!) has been edited, abridged and/or reformatted (some sub-titles and bold/italics emphases) for the sake of clarity and brevity to ensure a fast and easy read. This paragraph must be included in any article re-posting to avoid copyright infringement.
The article goes on to say in further edited excerpts:
The stock market has continued higher in the face of:
- economic uncertainty,
- global deflationary threats,
- an emerging market slowdown,
- a European recession,
- Middle East upheaval,
- increasing Russian aggression,
- political stalemates, and
- a never-ending supply of doubters.
However, even with the multitude of reasons to question the viability of the economic recovery, the market rally goes uninterrupted – without a 10% correction in over two years!
Though many are anticipating the inevitable correction, the market’s rise may persist regardless of the underlying risks. The market’s job, after-all, is to prove most people wrong; and if that is the case, it is only when the majority of bears give up that the market will “unexpectedly” fall.
While even I anticipate a large correction and even a recession over the next 1-2 years, we can continue investing so long as the upside momentum is intact. There are a few great investment opportunities right now and a multitude of incredible shorting opportunities coming within the next months. Until our 6 key indicators are triggered, a recession is not yet confirmed.
6 Signs of Impending Recession
1) Copper under $3
…copper is a major indicator of the health of the global economy…[because it]
- is a major commodity used heavily in many industrial settings and signals economic growth or contraction and
- copper and the stock market have moved in direction so closely that their wide divergence since 2011 is a huge puzzle and may be a huge hint.
(click to enlarge)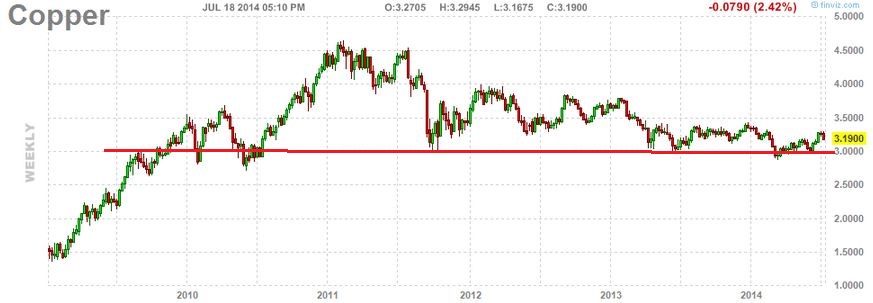
Since copper is so strongly tied to manufacturing and economic growth, falling copper prices are an early hint as to the future direction of the stock market.
In fact, falling copper prices were an early warning before the May 2010 correction and the 2011 crisis and slowdown. Now, as seen above, copper prices are struggling to stay above $3 and even broke below $3 for a very short time earlier this year.
If copper prices fall below $3 again, a major stock market correction or even global recession could be near.
2) Oil under $100
Similar to copper, the price of oil also signals the health of the economy as well as the inflationary situation. As seen below, crude oil has not made a new high since early 2011…
Slower growth and weaker inflationary forces lead to lower oil prices, and oil found strong resistance at $110/barrel. Stuck in a range between ~$75-110, oil is at a critical turning point – it must choose between a breakout above $110 toward new highs or a breakdown below $75 toward the decade lows. However, since $100 seems to be a very important level where a lot of the price action has gravitated to, we view the $100 level as critical support.
If prices fall below $100, and especially $90-95, the economic recovery could be in question as deflationary (and recessionary) forces take hold.
(click to enlarge)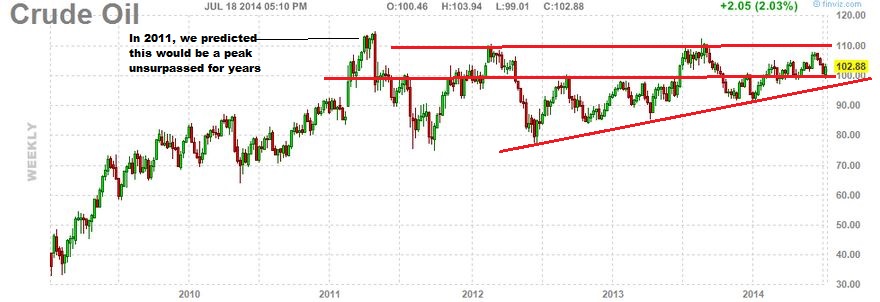
3) Apple…can’t sustain new all-time high
…Our view is that Apple will never be as dominant and enormously exciting as it was in the past…[and] that Apple may undergo a decade of stagnancy and loss of market share. It:
- is the #1 largest company in the US by market cap, at over $500B;
- has a huge weighting in the Nasdaq 100 and S&P 500; and
- is highly-owned by both individual investors and large funds and institutions.
(click to enlarge)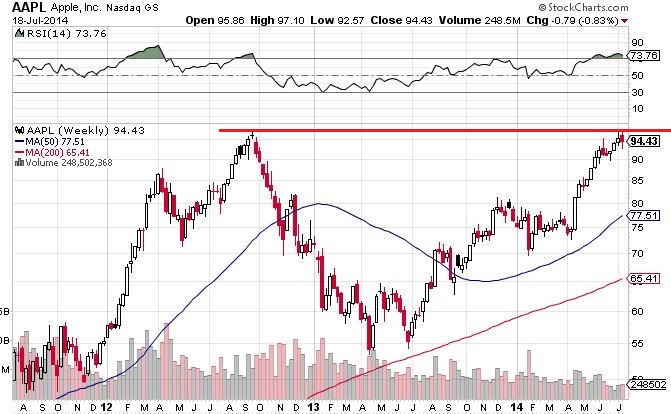
As Apple now stands at all-time highs, now acting as major resistance, the continuation of the rise in the stock price is crucial for the performance of the overall market.
If AAPL can’t sustain new highs and continue higher, the entire market rally may be in danger.
4) Junk Bonds…fall
The last place you want to be invested during a recession is Junk Bonds. So long as the economy is improving and borrowing remains cheap, even the weakest companies can survive and pay off their debts. It is no surprise, then, that one of the hottest investment themes since the end of the recession in 2009 (and a big hedge fund favorite) has been “junk” bonds and distressed debt. They pay higher interest to investors than risk-free US government bonds due to their much higher risk (though the junk bonds’ ~5% yields are now near record lows due to such massive demand).
However, there is a reason why they call them “junk” bonds – they are bonds of some of the lowest-rated and financially-weakest companies. They were great investments coming out of the recession since the financial and economic situation was so terrible at the lows but as the rally has continued, and as we approach an inevitable correction or recession, the major risks in junk bonds is magnified.
What happens when an economic contraction, financial hardship, or rising interest rates materialize? The companies which will likely suffer the most are those with the weakest financials. There is a reason why investors have so much faith in “safe” and financially-strong companies: They are much less likely to fall apart due to debt burdens or liquidity concerns. That is not the case with junk bonds, whose companies are some of the least-prepared to deal with a slowdown. Any financial shock can easily undermine the entire company’s solvency. If a correction or recession ensues, junk bonds can plummet or crash. These companies may not be able to pay their debts, and many of these junk bond issuances can become worthless…
Junk bonds are not only important, in and of themselves, their performance also tends to signal the direction of the overall stock market:
(click to enlarge)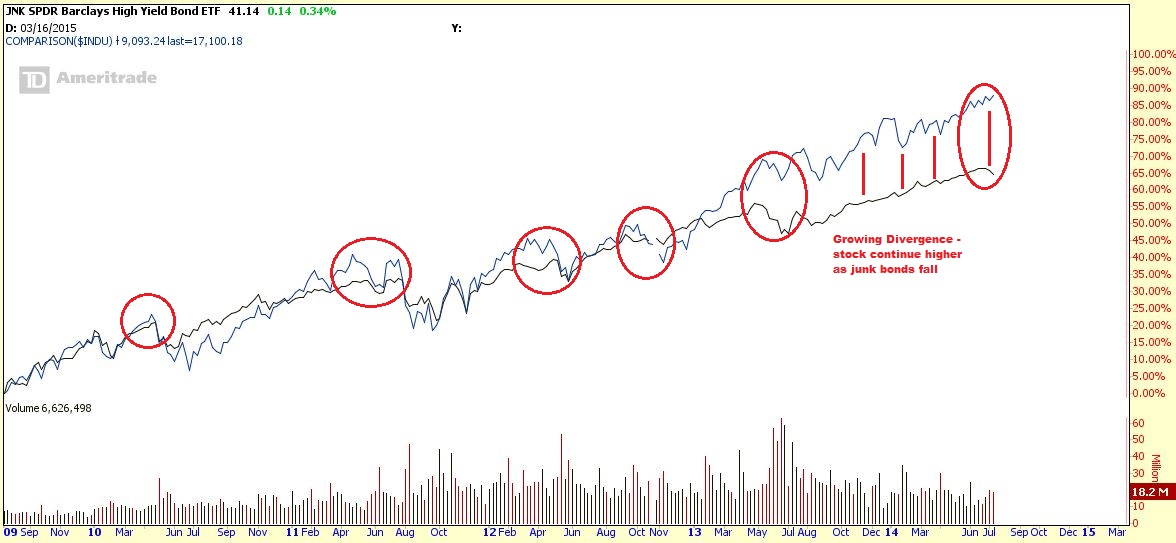
In the above comparison of junk bonds (black) vs. the Dow Jones Industrials Average (blue), it is…[shows] that:
- the rally in junk bonds has accompanied the rise in the stock market…[and that]
- the stock market corrections since the 2009 bottom have also coincided with corrections in the junk bond market.
- the May 2010 BP oil spill, the 2011 financial crisis and European recession, and the following smaller market pullbacks have all seen corrections in junk bonds as well.
Sometimes junk bonds even lead to the downside and give an early warning indicator of the upcoming stock market drop.
To make matters worse, since mid-2013 junk bonds have severely lagged the stock market and have formed a large divergence in performance. The stock market has continued sharply higher but junk bonds are weakening. Moreover, while the stock market is still at all-time highs, junk bonds appear to be rolling over.
If junk bonds continue their slide, there is a very high probability that the stock market will follow and, if junk bonds see a severe correction or crash, it is highly likely that a number of large financial institutions could be in danger or even insolvent.
5) M2 Money Supply shrinking.
The money supply is one of the key indicators of our growing or shrinking monetary base – a clear picture of the effect of monetary policy, money printing, and the devaluation of currency.
Paying attention to the money supply (published by the central bank) is highly important, since it could signal underlying changes in inflationary outcomes.
Monitoring changes in the money supply is very important due to its effects on price level, inflation, and exchange rates. The “Quantity Theory of Money” suggests a strong, direct relationship between the growth in money supply and long-term inflation.
In fact, while the U.S. has undertaken a very loose monetary policy with low interest rates, the M2 monetary base has grown tremendously. Note the extraordinary growth in M2 since 1980 and especially over the past 5 years.
(click to enlarge)
As long as money supply continues to grow, the Fed’s easy monetary policies continue to support increasing asset (and stock) prices in an attempt to create the desired inflation but there is a limit to how long such low interest rates and money printing can continue – political backlash, major financial risks, and the growing ineffectiveness of these policies stand as powerful opposition to this trend.
Since the money supply is (theoretically) highly correlated to inflationary pressures, any slowdown or decrease in money supply could be an early indicator of an upcoming economic slowdown or recession.
Just take a look at how the monetary base has grown by 400% since the 2008 recession (mostly due to Quantitative Easing (QE) and low interest rates):
(click to enlarge)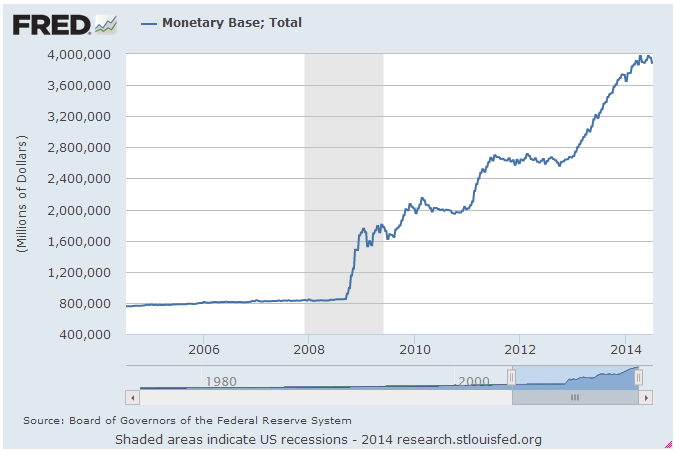
It is clear that the huge increases in money supply have greatly supported the rise in the stock market. However, we may be approaching a tightening cycle that results in a shrinking monetary base. If that is the case, an economic slowdown or stock market correction may be upon us as deflationary pressures build – but first we need a confirmation:
If the Monetary Base or M2 Supply shrinks consecutively for a 2-4 week period, a recession could be weeks or months away.
6) Dow Jones Industrials Average under 17,000.
It is crucial that the stock market (Dow Industrials) stays above 17,000 if the rally is to continue. Yes, it is going to be hard to remain at elevated levels, especially in the case of a 10%+ correction.
The 17,000 level was a major milestone and new all-time high. We can therefore draw our “line in the sand” at 17k and make that our critical support level. 17,000 may not be the EXACT support level (it could very well be 16,800 or another close number), but by focusing on a defined level – and especially an easy to monitor round number – we can greatly improve our risk management.
To put it simply: if the market falls below 17,000 we turn very cautious, but if it stays above 17,000 we are comfortable investing with the trend.
(click to enlarge)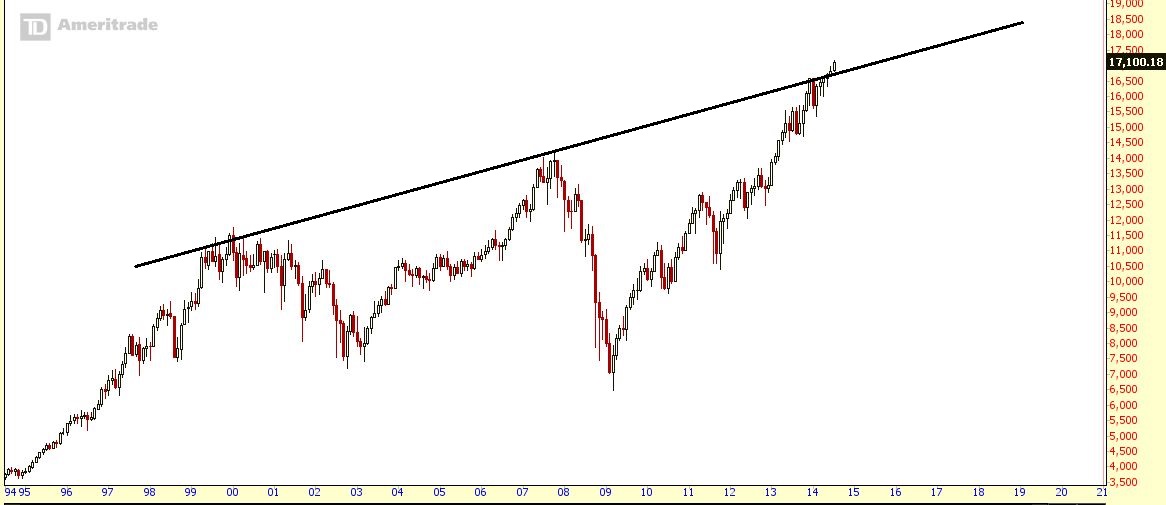
As you can see above, the stock market has seen huge ups and downs since the mid-1990s. Clearly visible are the 1999-2000 Dot-Com technology bubble peak, the 2007 housing peak and ensuing 2008 recession, and now – the 2014 all-time highs. We have broken above the top rising trendline, but we must hold these levels in order to ensure stability. It is not unreasonable to expect some sort of sideways movement, correction, or even crash at some point within the next few years.
(click to enlarge)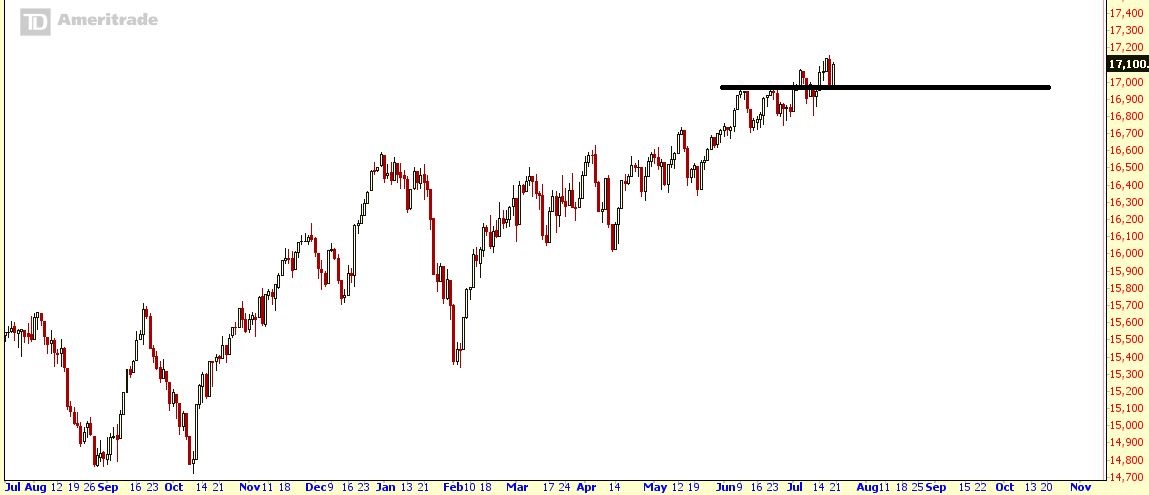
Though we have only recently broken above 17,000 on the Dow Industrials, it is now a very important support level. As a very easy to track, logical, and psychological support level, 17k is our key indicator of future market direction.
If the market stays above 17,000 we can continue to believe in the upward trend; but if the market drops below 17,000 we turn very cautious.
Conclusion
…Market jitters have escalated this year over the perceived overvaluation of momentum technology and biotech stocks, as well as the weakening performance of small-cap stocks (represented by the Russell 2000 index) but, so far, the stock market has consistently overcome a number of scary moments and potential de-railers of the economic recovery.
Although the risks of a major correction are growing every single day,
- the Fed is still supporting markets,
- the employment situation continues to improve, and
- China’s economy looks much better than it did a year ago (though these may reverse at any moment) and
- the U.S. economy is on the verge of a sustainable, self-feeding recovery.
If the U.S. economy doesn’t catch hold soon, however, a new recession is not unlikely….[not] a major market crash, but falling stock prices are probable.
Until we see confirmation of a slowdown or peak, however, we can follow the uptrend and just keep our eyes open for the clues.
Editor’s Note: The author’s views and conclusions in the above article are unaltered and no personal comments have been included to maintain the integrity of the original post. Furthermore, the views, conclusions and any recommendations offered in this article are not to be construed as an endorsement of such by the editor.
*http://seekingalpha.com/article/2330345-how-to-predict-the-next-recession?ifp=0 (© 2014 Seeking Alpha)
Follow the munKNEE!
- Register for our Newsletter (sample here)
- Find us on Facebook
- Follow us on Twitter (#munknee)
- Subscribe via RSS
Related Article:
1. Risk Aversion Has Run Its Course. What Are the Implications for the U.S. Economy Going Forward?
With QE now winding down, the economy facing reduced headwinds, and risk aversion beginning to decline, risk taking is beginning to increase and that is an essential ingredient for healthier economic growth. Read More »


