Are we near the end of one of history’s great stock market rallies? I don’t think so. Yes, prices are in the upper half of their long-term trends, but it’s not what you might call “scary-overvalued.” There is still plenty of room on the upside before historical precedents are violated. Let me explain further.
The above are edited excerpts from an article* by Scott Grannis (scottgrannis.blogspot.ca) entitled The big picture is not very scary.
The following article is presented by Lorimer Wilson, editor of www.munKNEE.com (Your Key to Making Money!) and the FREE Market Intelligence Report newsletter (sample here) and has been edited, abridged and/or reformatted (some sub-titles and bold/italics emphases) for the sake of clarity and brevity to ensure a fast and easy read. This paragraph must be included in any article re-posting to avoid copyright infringement.
Grannis goes on to say in further edited excerpts:
The U.S. stock market has been rising for more than five years; the S&P 500 has delivered a total return of 217% since early March, 2009. Today the S&P 500 reached a new all-time high of 1920. You can hear the nail-biting, especially since Q1/14 real GDP notched negative with today’s revision.
The two charts below help put things in perspective. The big picture is that the natural tendency of stock prices is to rise, which they have been doing for a very long time; that should hold as long as the economy is able to expand and inflation avoids negative territory. Economic growth is almost assured given ongoing growth in the population and in the number of jobs, and the Fed has taken extraordinary measures against an extended outbreak of deflation.
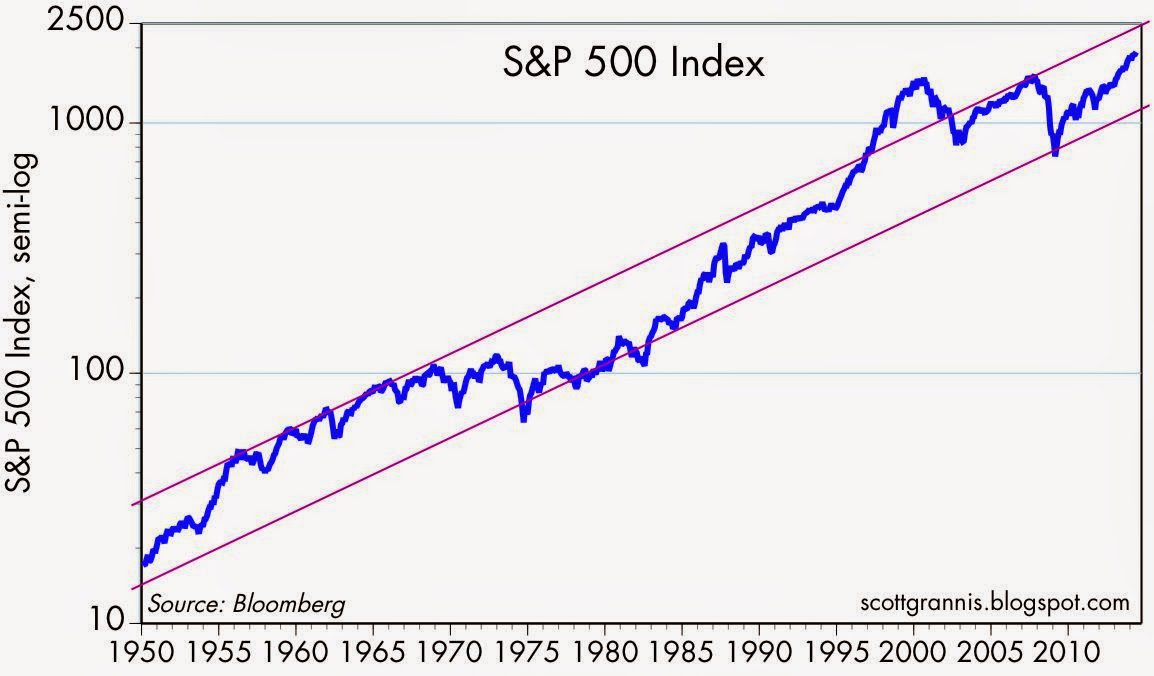
As the chart above shows, stocks tend to rise, on average, about 6-7% per year in nominal terms (plus dividends).
As the second chart below shows, stock prices tend to rise about 3% per year in real terms (plus dividends). Prices are in the upper half of their long-term trends, but it’s not what you might call “scary-overvalued.” There is still plenty of room on the upside before historical precedents are violated. This is also a plug for “buy and hold” investing. It’s near-impossible to call the highs and lows with enough exactitude to make a fortune but it’s easy to buy stocks when no one wants them—as was the case from late 2008 to early 2009—and hold on for the long haul.
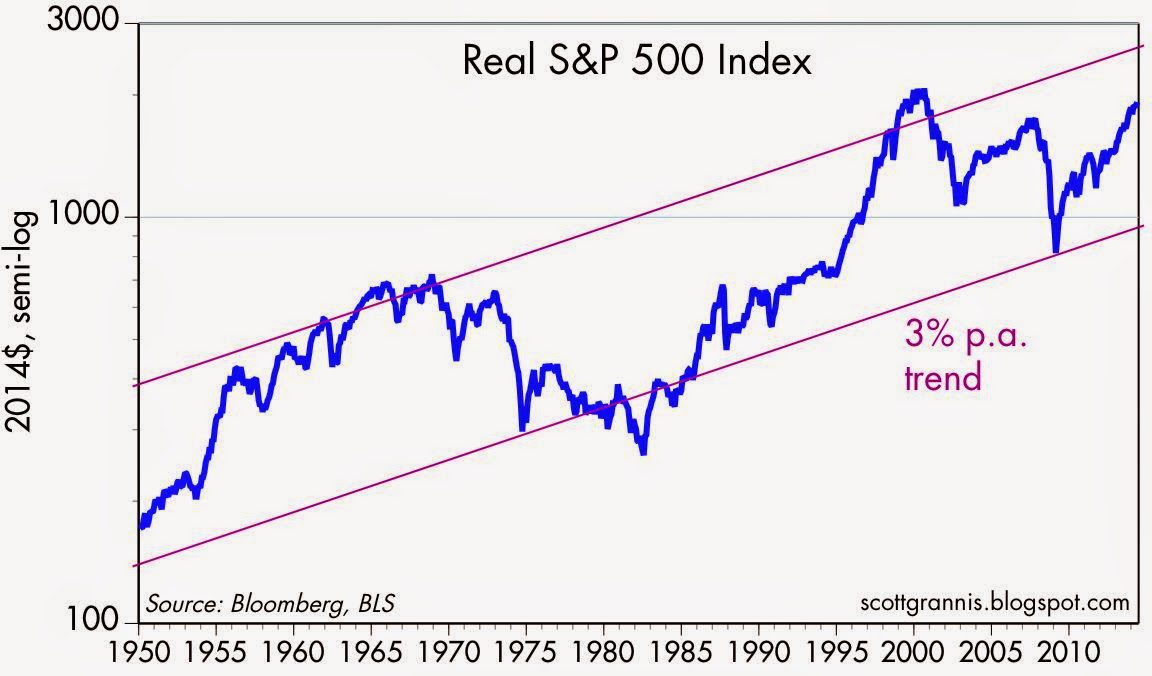
The message of the first two charts—that stocks are a little above their long-term average growth path—is confirmed by the chart below.
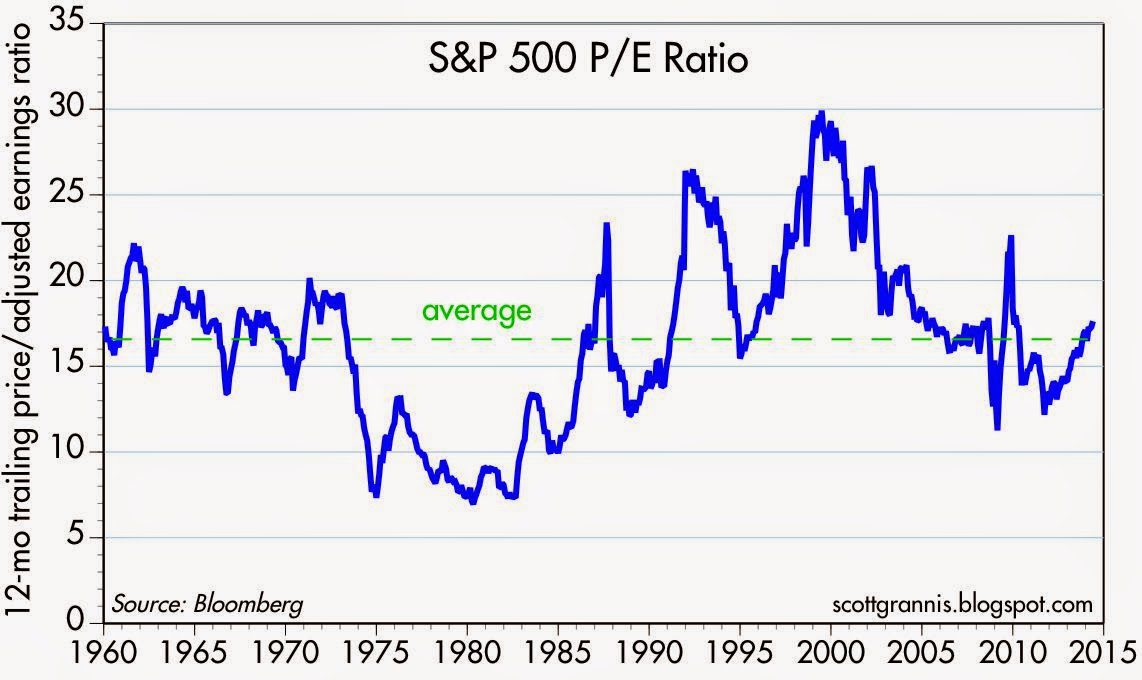
- The 12-mo. trailing PE ratio (according to Bloomberg) of the S&P 500 is now 17.6, which is about 6% above its 55-year average of 16.6. By this measure, stocks are somewhat “overvalued,” but not be a significant amount.
- Moreover, if you consider that Treasury yields are still historically low (the PE ratio of the 10-yr Treasury, which currently yields 2.5%, is 40), it’s not unreasonable at all for PE multiples on equities to be above average.
Show me an investor who prefers 10-yr Treasuries to equities today, and I’ll show you an investor who expects corporate profits to plunge and the bond market does not reveal any concerns about the future of corporate profits. Moreover, swap spreads, an excellent and leading indicator of systemic risk, are very near all-time lows. Absent a plunge in profits, equities could handily outperform Treasuries, even on a risk-adjusted basis….
Editor’s Note: The author’s views and conclusions in the above article are unaltered and no personal comments have been included to maintain the integrity of the original post. Furthermore, the views, conclusions and any recommendations offered in this article are not to be construed as an endorsement of such by the editor.
*http://scottgrannis.blogspot.ca/2014/05/the-big-picture-is-not-very-scary.html
Related Articles:
1. The Best Stock Market Indicator – Ever
Below is a description of what I believe to be the best stock market indicator – ever. I am referring to the percentage of S&P 100 stocks above their 200 DMA which gives traders a clear early warning signal of impending serious market downturns and later safe re-entry points. Read More »
2. Don’t Try to Time the Market; Dollar-Cost Average Instead. Here’s Why
…Everyone is worrying that we are at or near a market peak and this has investors extremely hesitant to buy stocks for fear of a big decline or perhaps even a crash. Obsessing over the risk of a crash, however, could lead to analysis paralysis but there is a basic investing strategy that can save investors from losing too much hair as they make the decision to buy stocks. It’s called dollar-cost averaging. Let me explain how it works and why it’s great for investors with long-term investing horizons. Read More »
3. Stock Market Crash Coming? Here’s How to Protect Yourself
Following the 2007-09 financial crisis, many investors decided they needed insurance on their portfolio to protect against the possibility of another “black swan” event and poured money into a host of new funds that were supposed to help if there was another downturn — long/short funds, tail risk strategies, absolute return funds, option hedging strategies, tactical asset allocation funds and the like – but they missed the idea completely. They were trying to plan ahead for uncertain events that could surprise everyone. Of course this is impossible, because you can’t hedge out the risks of unknown events – they’re unknown after all. So how should an investor protect oneself from another such occurrence? The answer is below. Read More »
4. Yes, You Can Time the Market – Use These Trend Indicators
Remember, the trend is your friend and now you have an arsenal of such indicators to make an extensive and in-depth assessment of whether you should be buying or selling. If ever there was a “cut and save” investment advisory this article is it. Words: 1579 Read More »
5. Ride the Market Waves With These 6 Momentum Indicators
It is hard to know what to buy or sell let alone just when to prudently do so. Thank goodness there are indicators available that provide information of stock and index movement of a more immediate nature to help you make such important decisions. This article describes the 6 most popular Momentum Indicators. If ever there was a “cut and save” investment advisory this is it! Words: 1234 Read More »


