The Great Stagnation of 2011
[The economic news is not very encouraging these days. Everywhere I’ve looked, and I’ve looked at 10 different indicators (surveys, polls and indexes), things appear to be either down or stagnant. Let me be more explicit.] Words: 1058
So says Econophile, Jeff Harding, (www.dailycapitalist.com) in excerpts from an article* which Lorimer Wilson, editor of www.munKNEE.com (It’s all about Money!), has further edited ([ ]), abridged (…) and reformatted below for the sake of clarity and brevity to ensure a fast and easy read. Please note that this paragraph must be included in any article re-posting to avoid copyright infringement. Harding goes on to say:
1/2. Philadelphia Fed Survey and the Empire State Manufacturing Survey
Both the Empire State Fed and the Philadelphia Fed manufacturing surveys reported substantial drops in economic activity:
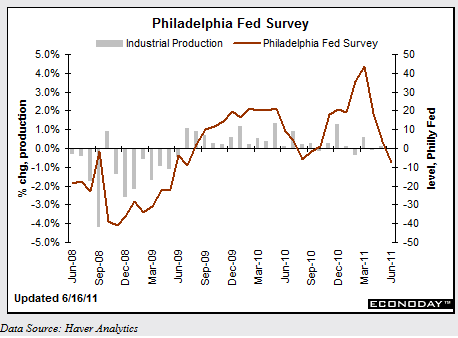
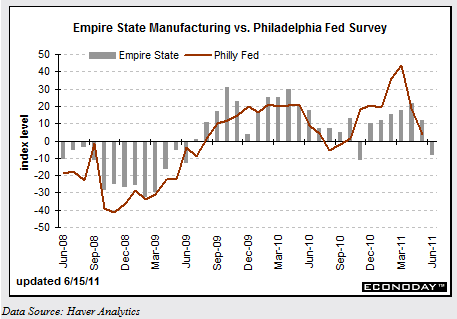
The Philadelphia dropped 7.7% (the first drop since September) and NY dropped 7.8% (the first drop since November). The weakness was in new orders and inventory accumulation, things that you don’t want to see decline. Separately, the inventory-to-sales ratio increased 0.8%, a small but negative indicator.
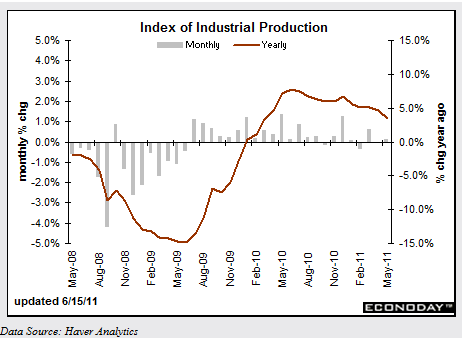
3. Index of Industrial Production
The index of industrial production as announced by the Fed was flat in May, up 0.1%, but the year-over-year trend was still declining:
4. Retail Sales
Retail sales for May came out slightly negative (-0.2%), but that is a bit misleading. Here is the chart:
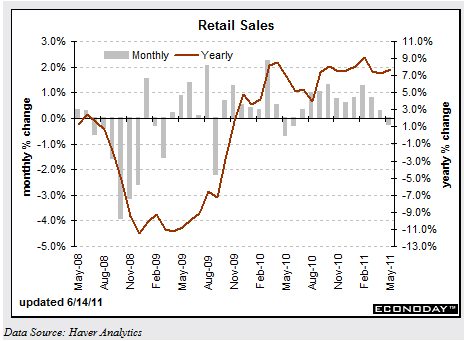
The trend has been flat-to-negative since January, 2011. For several reasons economists like to strip out auto sales, a big ticket item that may skew the data. Doing that, excluding autos, retail sales were up 0.3%. Again the data is confusing because the excluding auto data still includes gasoline sales which were up 22.3% YoY. Gains were seen in health care, building materials, miscellaneous retailers, and non-store (Internet) retailers.
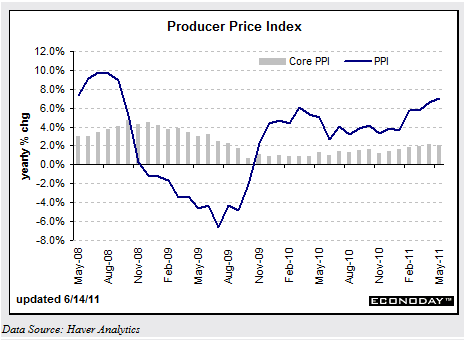
5. Producer Price Index
The PPI and CPI reports also came in last week. Starting at the producer level, the PPI increase moderated to a 0.2% gain (core, excluding energy and food, up 0.2%) but the year-over-year trend was still up 7.0% in May (excluding energy and food, up 2.1%). The PPI has been declining since January, 2011, but the rate of increase is still high:
6. Consumer Price Index
The May CPI also was up 0.2%, slightly less than in April, but still a strong upward trend as shown in this YoY chart (up 3.2% YoY):
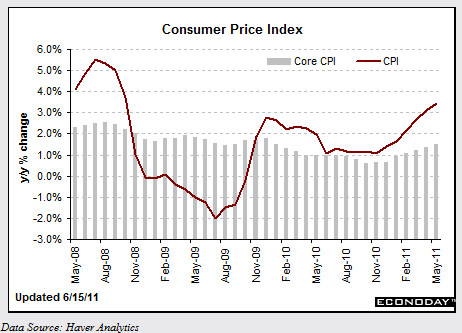
Excluding energy and food, it was up 0.3% for the month, and 1.5% YoY. Apparel, shelter, new vehicles, and recreation were all up, but energy and gasoline were down along with airline fares, tobacco, and personal care. This price inflation may seem mild to the casual observer, but it is the trendline that is important.
7. The Misery Index
The Misery Index was created back in the 1970s and is described thusly:
It is simply the unemployment rate added to the inflation rate. It is assumed that both a higher rate of unemployment and a worsening of inflation both create economic and social costs for a country. A combination of rising inflation and more people out of work implies a deterioration in economic performance and a rise in the misery index.
The Index is now at 12.16. To put this in perspective, it was at its highest, 20.76 during the Carter Administration, and hasn’t been this high since 1983 (it declined after Reagan was elected). Its lowest points were 3.53 during the Eisenhower Administration (1953) and again during the Clinton years, 6.05 in 1998. This has resulted in a decline in consumer confidence.
8. Economic Confidence Index
The Gallup Economic Confidence Index declined 9 points in the past two weeks (ending June 12):
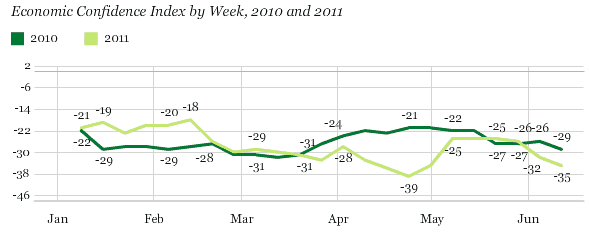
9. The Reuters/Univ. of Michigan consumer sentiment poll reflected a similar decline.
10. Small Business Optimism Index
The National Federation of Independent Business’ (NFIB) Small Business Optimism Index declined again, for the third straight month:
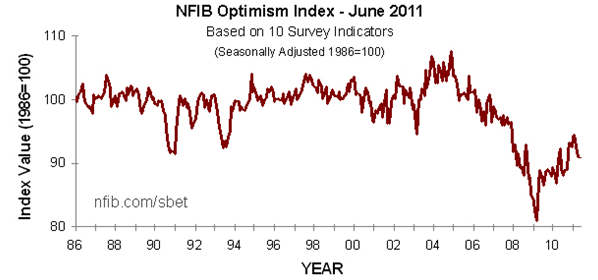
“Corporate profits may be at a record high, but businesses on Main Street are still scraping by,” said NFIB chief economist Bill Dunkelberg [going on to say] “For the third month running, several key economic indicators continued their downward tumble.
- Job market indicators continued to deteriorate, anticipating very weak job creation and a higher unemployment rate.
- Capital spending plans and inventory investment plans all weakened and remain at recession levels.
- Inflation continues to rise [which is] a notable business concern for owners who are raising their own prices at the fastest pace seen in years.
Driving the economic uncertainty [is the fact that] one in four owners still report weak sales as their top business problem (followed by taxes and regulations and red tape [while] only 3 percent cite financing).
The most important thing among these data was the lack of capital spending: Capital spending remains historically low in spite of very low interest rates and all sorts of expensing incentives. Fifty percent of firms reported making capital expenditures over the past six months, and the percent of owners planning capital outlays in the next 3 to 6 months fell 1 point to 20 percent, a recession level reading.”
What does all this mean? It means that the foundry of job creation for one-half of the new jobs created in America, small businesses, are stalling out again because of all the factors discussed above. Also, I wouldn’t expect a lot of job growth from the multinationals as not even a declining dollar can offset the cooling-off of demand from money-stimulated countries like China, India, and Brazil.
Conclusion
Consumers aren’t going to save our economy from stagnation [which] will continue along with inflation…[and their is still] a likelihood of QE3.
*http://dailycapitalist.com/2011/06/20/the-great-stagnation-of-2011/
Related Articles:
- Slip Sliding Away: Signs Point to Ongoing Economic Decline in U.S.
- Current Economic Recovery is a Sham! Here’s Why
- What Decline? U.S Economy Holding Up Exceptionally Well!
- Get Ready: Economic Hell is Coming!
Editor’s Note:
- The above article consists of reformatted edited excerpts from the original for the sake of brevity, clarity and to ensure a fast and easy read. The author’s views and conclusions are unaltered.
- Permission to reprint in whole or in part is gladly granted, provided full credit is given as per paragraph 2 above.