The Swimsuit Issue Indicator says that U.S. equity markets perform better in years when an American appears on the cover of Sports Illustrated’s annual issue as opposed to years when a non-American appears on the cover. [What is the nationality of this year’s cover model? Can we expect returns above the norm or will we see a year of underperformance for the S&P 500 this year? Read on.] Words: 323 ; Table: 1
So says Bespoke Investment Group (http://www.bespokeinvest.com/) in edited excerpts from an article* posted on Seeking Alpha under the title Sports Illustrated Swimsuit Issue: Score Another For Bulls.
This article is presented compliments of www.munKNEE.com (Your Key to Making Money!) and may have been edited ([ ]), abridged (…) and/or reformatted (some sub-titles and bold/italics emphases) for the sake of clarity and brevity to ensure a fast and easy read. Please note that this paragraph must be included in any article re-posting to avoid copyright infringement.
The article goes on to say in further edited excerpts:
Sports Illustrated has confirmed that the cover model of this year’s Swimsuit Issue is once again America’s own Kate Upton.
The table below highlights the annual total return of the S&P 500 since 1978…For each year, we also show the country from which that year’s Sports Illustrated Swimsuit Issue cover model came from as well as a link to the cover.
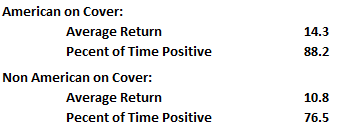
Since 1978, an American has now appeared on the cover of the annual issue in 18 different years:
- The average total return of the S&P 500 during the 18 prior years has been a gain of 14.4% with positive returns 88.9% of the time.
Of the 17 years where a foreigner appeared on the cover:
- the S&P 500 has averaged a total return of 10.8% with positive returns 76.5% of the time.
To be sure, we should note that the S&P 500’s 38.5% decline in 2008 when an American appeared on the cover caused the spread between the two performance numbers to narrow considerably (somebody check Marissa Miller’s birth certificate).
[Click on each of the 35 hyperlinks below to see the Sports Illustrated Swimsuit Issue cover model for that year.]
|
||||||||||||||||||||||||||||||||||||||||||||||||||||||||||||||||||||||||||||||||||||||||||||||||||||||||||||||||||||||||||||||||||||||||||||||||||
 |
||||||||||||||||||||||||||||||||||||||||||||||||||||||||||||||||||||||||||||||||||||||||||||||||||||||||||||||||||||||||||||||||||||||||||||||||||
[As can be seen above,] last year the Swimsuit Indicator worked like a charm as the S&P 500 saw a total return of 16.0% with Kate Upton’s first cover. Bulls can only hope that the encore (for the market) is equally as good….
Editor’s Note: The author’s views and conclusions are unaltered and no personal comments have been included to maintain the integrity of the original article. Furthermore, the views, conclusions and any recommendations offered in this article are not to be construed as an endorsement of such by the editor.
*http://seekingalpha.com/article/1172551-sports-illustrated-swimsuit-issue-score-another-for-bulls
Register HERE for Your Daily Intelligence Report Newsletter
It’s FREE
The “best of the best” financial, economic and investment articles
An “edited excerpts” format to provide brevity & clarity for a fast & easy read
Don’t waste time searching for informative articles. We do it for you!
Register HERE and automatically receive every article posted
“Follow Us” on twitter & “Like Us” on Facebook
Related Articles:
1. QE Could Drive S&P 500 UP 25% in 2013 & UP Another 28% in 2014 – Here’s Why

Ever since the Dow broke the 14,000 mark and the S&P broke the 1,500 mark, even in the face of a shrinking GDP print, a lot of investors and commentators have been anxious. Some are proclaiming a rocket ride to the moon as bond money now rotates into stocks….[while] others are ringing the warning bell that this may be the beginning of the end, and a correction is likely coming. I find it a bit surprising, however, that no one is talking of the single largest driver for stocks in the past 4 years – massive monetary base expansion by the Fed. (This article does just that and concludes that the S&P 500 could well see a year end number of 1872 (+25%) and, realistically, another 28% increase in 2014 to 2387 which would represent a 60% increase from today’s level.) Words: 600; Charts: 3
2. The S&P 500 Continues to Rapidly Build Its “Domed House” As Projected

The broad stock market is on its way to building a “Domed House” and to challenge multi-year highs, or even all-time highs, in the process. Words: 634; Charts: 2
3. Investors, Get Fully Invested! S&P 500 On Verge of Entering Euphoria Stage of Cyclical Bull Market

4. What You Should Know About the “Dogs of the Dow” Investment Strategy

The “Dogs of the Dow” is a simple and effective strategy that has outperformed the Dow over the last 50 years and generates almost 4% in yield. Here’s how it works. Words: 486
I wonder if a fold out, would take the Market to a new high?