…[Today’s] irrational exuberance will slowly morph into fear and panic  as stocks begin to crash, only this time the Dow Index and S&P500 Index may well suffer more severe losses. Moreover, it is highly probable that global stock markets will accelerate and exacerbate their prevailing bear market trends.
A guest post by I.M. Vronsky (Gold-Eagle.com) which has been slightly edited ([ ]) and abridged (…) to provide a faster and easier read.
…Below are…many fundamental and technical indicators heralding an on-coming big bear market in US Stocks.
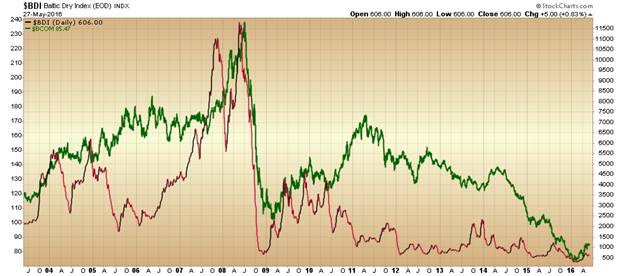
Baltic Dry Index
The Baltic Dry Index (BDI) is an economic indicator issued daily by the London-based Baltic Exchange. Not restricted to Baltic Sea countries, the index provides “an assessment of the price of moving major raw materials by sea.”
The index indirectly measures global supply and demand for the commodities shipped aboard dry bulk carriers, such as building materials, coal, metallic ores, and grains.
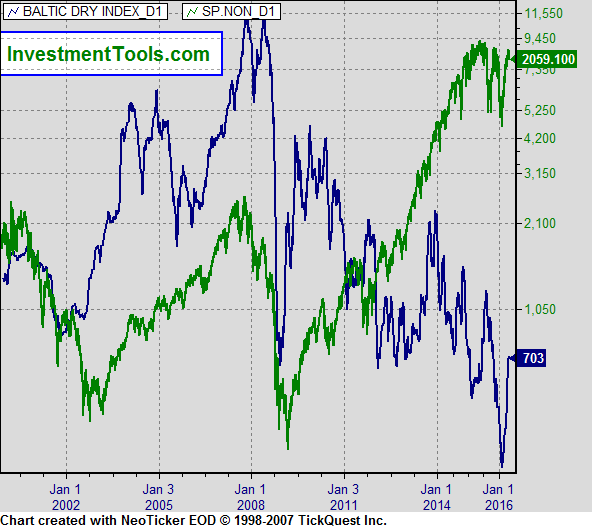 SOURCE: http://www.investmenttools.com/
Because dry bulk primarily consists of materials that function as raw material inputs in the production of intermediate or finished goods, such as concrete, electricity, steel, and food, the index is also seen as an efficient economic indicator of future economic growth and production. The BDI is termed a leading economic indicator because it predicts future economic activity.
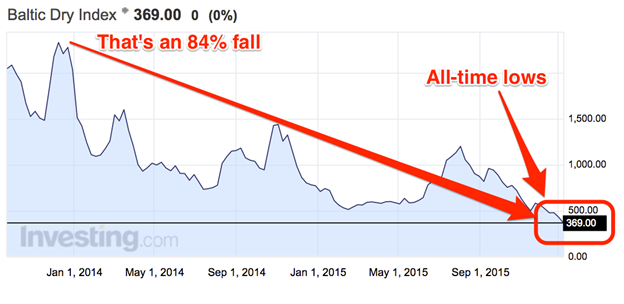
Nightmarishly, the Baltic Dry Index (BDI) is at an all-time low.
With a view to putting the BDI into perspective [below]… are two charts:
1. BDI vs the Bloomberg Commodity Index
2. BDI vs Commodity Research Bureau Index (CRB)
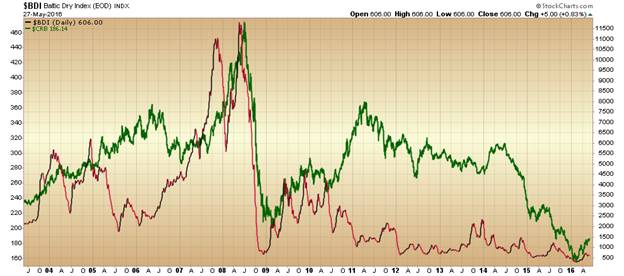
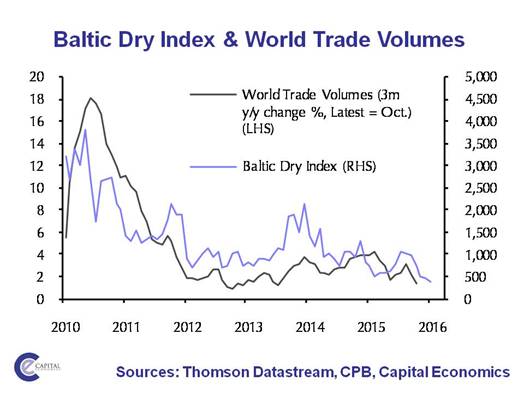
Obviously, the BDI runs in tandem with both the Bloomberg Commodity Index (BCOM) and the Commodity Research Bureau Index (CRB). Clearly, demand on average for all commodities is falling dangerously…implying hard economic times are brewing on the horizon…as world trade volumes relentlessly decline.
Leading Economic Indicators
Economic indicators are among the most closely watched pieces of news in the investment world. Practically every week there is some announcement that affects investors’ predictions about the future of the economy.
Leading indicators are those which are believed to change in advance of changes in the economy, giving you a preview of what is going to happen before the change actually occurs...In addition, the Fed watches many of these indicators as it decides what to do about interest rates.
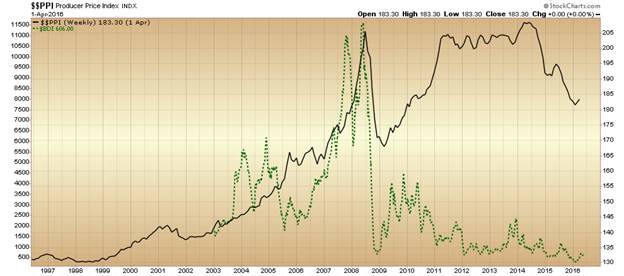
1. Producer Price Index
Among the Leading Economic Indicators closely watched is the Producer Price Index (PPI) shown…[below] with the BDI super-imposed. It is imperative to… [take] particular notice that the PPI materially declined in 2001 and 2008, indicating stocks were sure to drop. Since 2014…the PPI…[has been] in a lethal dive…which is a precursor to a new bear market in stocks.
…[Below] are more charts showing technical indicators that strongly suggest a bear market in US stocks is brewing.
2. Bearish Triple Top In Dow/US Bonds (1998-Present)
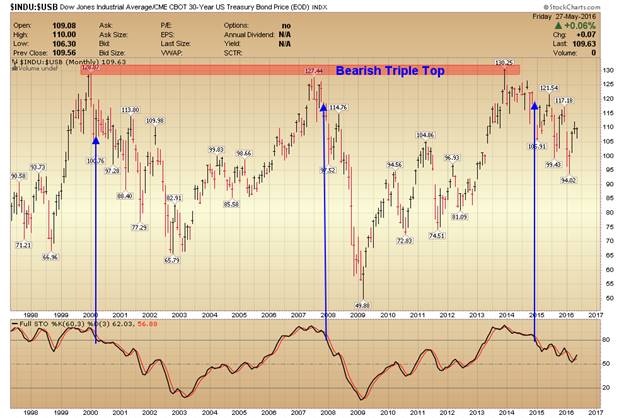
The bearish triple top above is confirmed by the full stochastics technical indicator, which suggests the Dow Index may decline more than it did in the two previous bear markets.
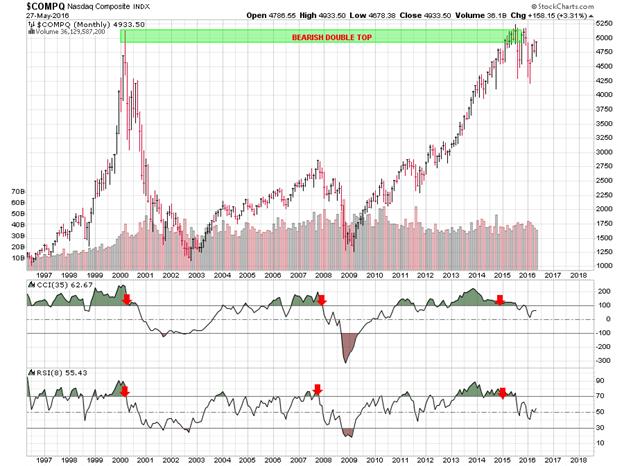
3. Bearish Double Top In NASDAQ Composite Index (1996-Present)
The NASDAQ Index has formed a bearish double top pattern, where red arrow indicators signal each decline [as noted in the chart below].
4. US Bank Index
[As can be seen in the chart below] the US Bank Index is already in a bear market [just] as it was in the 2007-2008 bear market.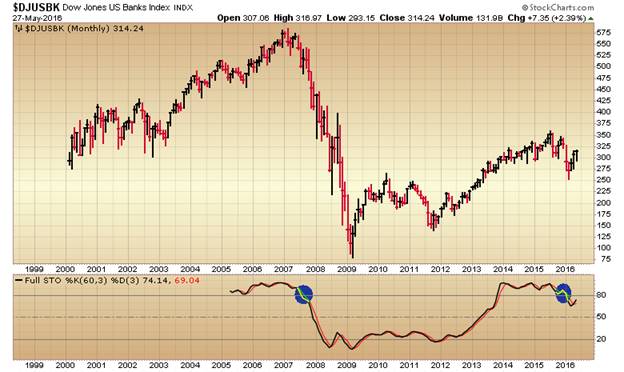
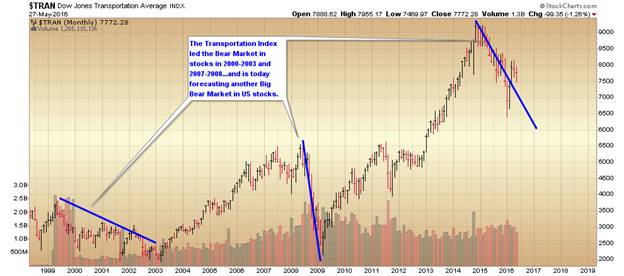
5. Transportation Index As A Leading Indicator To US Stocks
6. NYSE Margin Debt At An All-time High
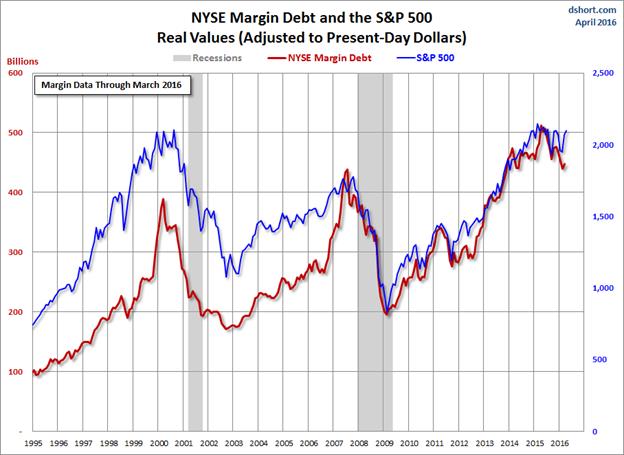
…Too many speculators have run up the NYSE Margin Debt to record levels (see chart above). Needless to say, record levels coincided with the beginning of the 2000-2003 and 2007-2008 bear markets and recently the NYSE margin debt…set an all-time record high…which may well lead to a major selloff in US equities.
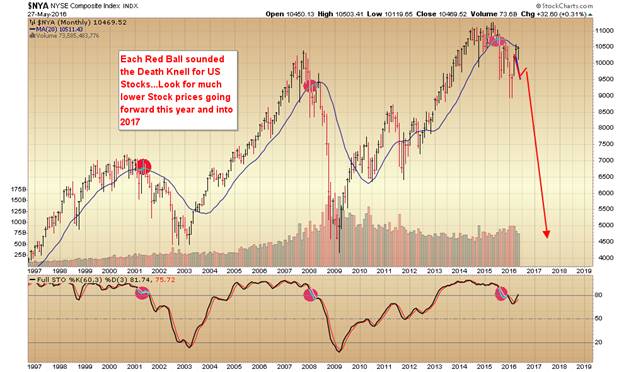
7. The New York Stock Exchange Composite Index
The NYSE Index is unquestionably the leader of Wall Street’s band and today the NYSE Index is…in the death throes of a new bear market. In the past, the 20-month MA (moving average) has been the all-important resistance…[and it] has again been punctured…just…[as] occurred in 2001 and 2008…releasing hordes of bears into Wall Street. Soon it will be a situation of katie=bar-the-door as the raging bears come marauding into US stock market.
Conclusion
If history is testament, then the above charts indubitably suggest the global economy is edging toward another recession which eventually may plunge into another 1930s like Great Depression. [As such, it is imperative that you be] conservative, careful, prudent and wise in order to preserve your hard earned wealth – and the life-style you have come to enjoy.
“Follow the munKNEE” on Facebook, on Twitter or via our FREE bi-weekly Market Intelligence Report newsletter (see sample here , sign up in top right hand corner)