…There…[has been] very little interest in investing in foreign stocks over the past decade…[but] that was a mistake. [Had you]…invested in the cheapest 25% of countries based on the CAPE ratio from 1993 to 2018 [you] would have tripled your money compared to investing in the S&P 500.
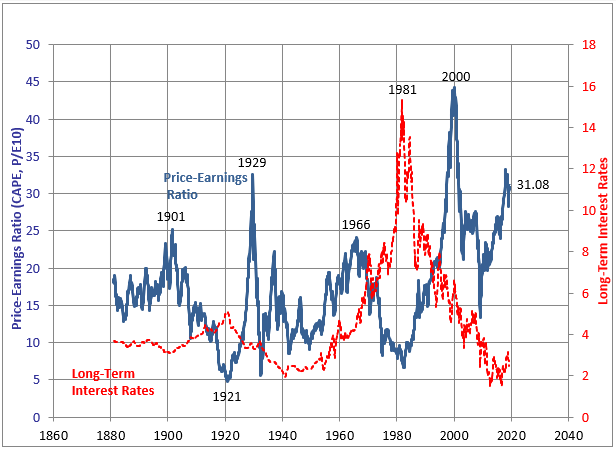
The cyclically-adjusted price-to-earnings (CAPE) ratio, popularized by Yale professor Robert Shiller, divides the current price by the past 10 years of inflation-adjusted earnings. It gives you a better idea of how cheap a stock or a market of stocks is relative to a full business cycle of earnings rather than potentially one year of peak or trough earnings. Over a century of data suggests that periods of high CAPE are associated with low forward returns for the S&P 500 (SPY) and periods of low CAPE are associated with high forward returns. It doesn’t give much insight on how to time the market in the short term, but it does give insight on the probability distribution of long-term forward returns for a given market.
…As interest rates have trended down in the United States, CAPE ratios have gone up a lot [yet,] despite historically high CAPE ratios in recent years, S&P 500 stock returns have still been pretty good. CAPE ratio critics have argued that this renders the CAPE ratio rather irrelevant.

(Chart Source: Robert Shiller Online Data)
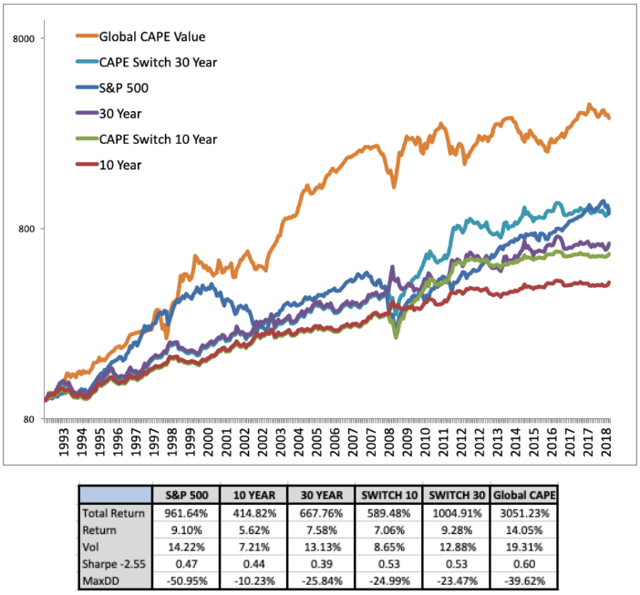
A great article by Meb Faber, [however,] shows why it’s important to think more globally. The United States is not your only pond to fish in. Specifically, his research shows that from 1993 to 2018, investors who continually built a portfolio around the cheapest 25% of countries based on the CAPE ratio(orange line below) would have generated 3051% total returns over 25 years, compared to 961% returns from the S&P 500 (dark blue line below):
(Chart Source: Meb Faber, Cambria Investment Management)
That chart is logarithmic rather than linear, so it actually understates how well that strategy performed. The table outlines it more clearly. On an annualized basis, the low global CAPE strategy provided about 14% annual returns vs. 9% annual returns for the S&P 500. The volatility of the low global CAPE strategy was higher than the S&P 500, but its maximum drawdown was actually lower due to geographic diversification…
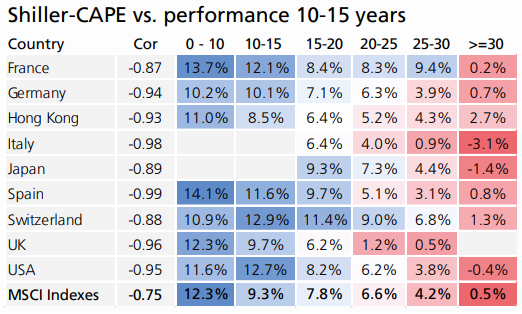
The research group at Star Capital has shown similar results. For 17 developed markets over a 36-year period between 1979 and 2015, buying country markets when the CAPE ratio was low vastly outperformed buying country markets when the CAPE ratio was high:

(Chart Source: Star Capital Research in Charts)
Sometimes many markets are highly valued or cheaply valued at the same time, and other times you can find pockets of value while others remain expensive. Of course, that’s no guarantee of future returns. It’s plausible that this strategy could stop working, although I haven’t seen a compelling case as to why it would.
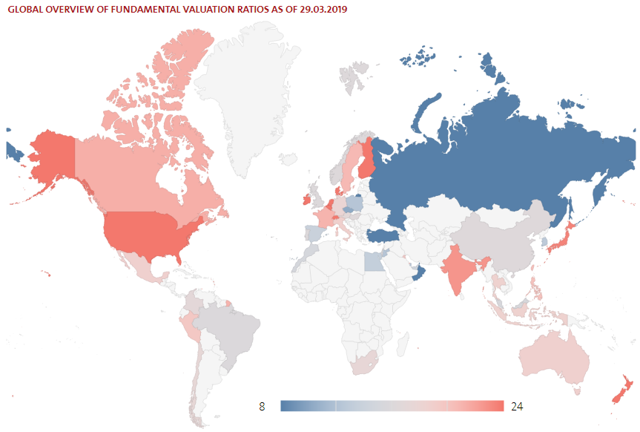
Star Capital maintains a great interactive map that shows you the cheapest markets based on a variety of metrics, including CAPE:
(Chart Source: Star Capital Valuation Map)
Right now, Russia (RSX), Turkey (TUR), Poland (EPOL), South Korea (EWY), Singapore (EWS), Spain (EWP), Malaysia (EWM), Israel (EIS), and Brazil (EWZ) have among the lowest CAPE ratios. The UK (EWU) and China (MCHI) aren’t far behind.
The caveat [to the investment strategy being put forth here] is that:
- it would be an awful, scary, gut-wrenching strategy to follow, not necessarily due to volatility, but due to headlines.
- Everything you would read about your portfolio would be bad, as you’d be invested in places like Russia, Turkey, and Italy all the time.
- It’s the quintessential strategy of buying when there is blood in the streets, on a global scale. Most people can’t handle that, especially during multi-year periods where the strategy is underperforming.
- The saving grace, however, is that this type of strategy is diversified, so one or two value traps (situations where a low-CAPE country provides poor long-term returns anyway) likely won’t derail the strategy.
Putting it All Together
The reason that buying cheap markets historically works well is a sum-of-parts outcome. Cheaper markets
- typically have higher dividend yields,
- their low valuations are more likely to expand than contract,
- and their weak currencies are more likely to at least partially revert to the mean than sink further when considered over a long timeline. In contrast to the common saying that trees don’t grow to the sky, the majority of markets do not fall permanently into an abyss, either.
 munKNEE.com Your Key to Making Money

