Now that we are at a crossroads in both commodity and equity markets heavy technical analysis, in addition to a standard fundamental outlook, may prove useful in identifying the next big swings – before they occur – for gold, silver), and crude oil… [and answer the prevailing question of those looking to establish, or re-establish, commodity positions: “Is now the time to jump into one or more of these markets or should I] sit on the sidelines a bit longer. [Let’s take a look.] Words: 2012
So says Brian L. Wilson in an article* which Lorimer Wilson, editor of www.munKNEE.com, has further edited ([ ]), abridged (…) and reformatted below for the sake of clarity and brevity to ensure a fast and easy read. Please note that this paragraph must be included in any article re-posting to avoid copyright infringement. Wilson goes on to say:
A: Gold
Fund: SPDR Gold Trust (GLD)
Gold has been the primary go-to commodity for inflation hedging for years now. As the primary store of wealth throughout history, its recent appeal as a safe haven against currency debasement has driven the price up significantly in addition to its increasing demand. Despite the commodities selloff which has crushed silver and oil spot prices, gold has been more resilient. Looking at its price history, this makes sense as gold has had steady appreciation for years. If a bigger correction ever did come, gold investors may have more time to exit their positions.
With a recent turnaround in the value of the U.S. dollar, whether gold still remains an attractive asset at the… 1500$/oz. [see this article (1) for the correct designation of ozt. not oz.] level is largely up to speculation rather than any easily understandble economics. [While] some will argue that gold has reached the bubble stage – and the widespread popularity of the yellow metal does add to this argument – [gold is, nevertheless,]… the most popular hedge against impending inflation.
[The graph below shows the MACD and the RSI for gold over the past year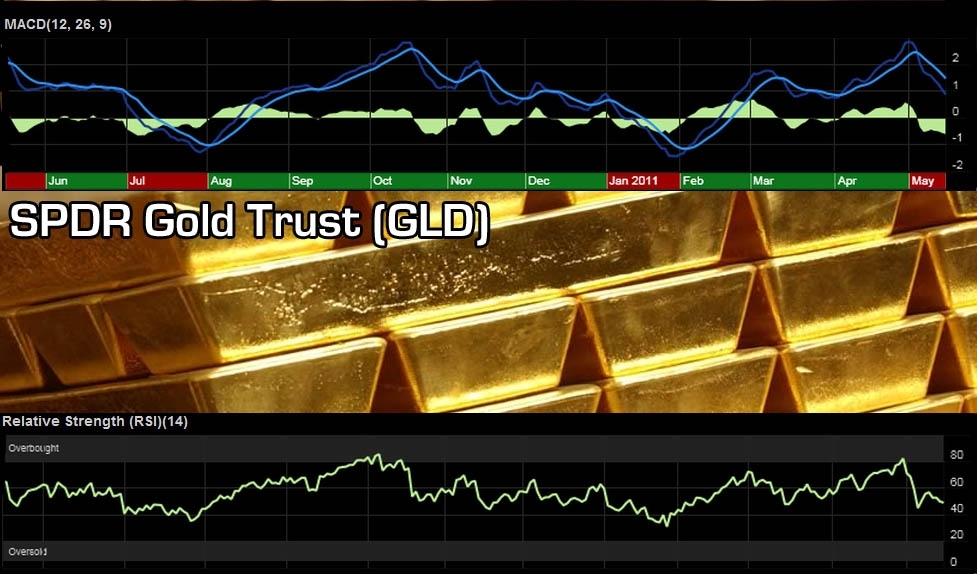
The MACD Trend for Gold
MACD measures how the 12 and 26 day exponential moving averages behave relative to each other. [For a more detailed description of this indicator and others in the trend category read this article (2) entitled “Yes, You Can Time the Market – Use These Trend Indicators.”] Positive MACD will indicate upward price acceleration for instance.
Sign up for FREE weekly “Top 100 Stock Index, Asset Ratio & Economic Indicator Trends”
In the case of GLD, one can see that there is accelerating downward pressure in the gold market. The 12 day EMA (exponential moving average) is dropping faster than the 26 day can keep up, signaling that:
The selling [in gold] is going to stay and possibly accelerate in the near future. The declining 12 day EMA is a strong bearish signal, but this kind of downward pressure isn’t sustainable for very long.
The RSI Momentum for Gold
The RSI measures momentum through an equation which factors in gains and losses made in 14 periods (days in this case). In layman’s terms, it describes what the market is doing. High is buy, low is sell. [For a more detailed description of this indicator and others in the momentum category read this article (3) entitled “Ride the Market Waves With These 6 Momentum Indicators.”]
One can see that the gold market became overbought at the end of April, before dropping to a more even territory in just a week.
Right now gold is neither overbought nor oversold, so RSI suggests sideways trading for now.
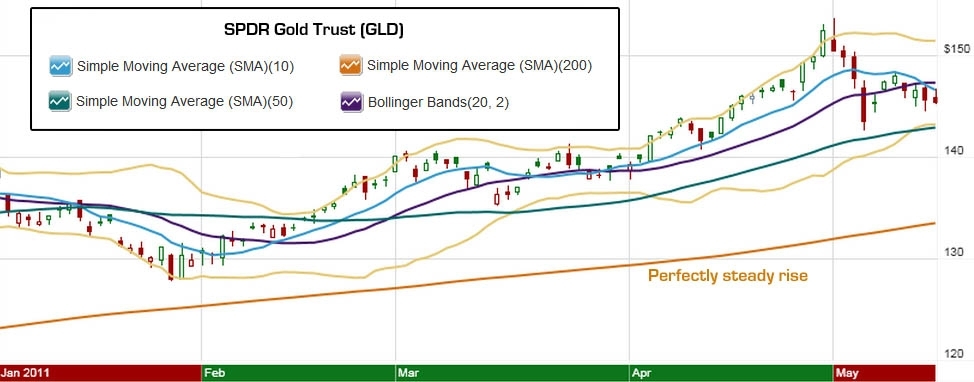
The Volatility Indicator for Gold
GLD’s chart [above], with some key moving averages and bollinger bands [For a more detailed description of this volatility indicator read this article (4) entitled “Here’s How to Time the Market!”] added in provides another view which suggests that:
Gold will remain somewhat immune to the volatility of the commodity markets in the near future...
While the 10 day moving average is in a steady decline (approaching the 50 day average and crossing the 20 day), the drop is not steep enough to signal any drastic changes in the foreseeable future and paints:
A neutral, albeit slightly bearish, picture for the short term price action of gold.
A steadily increasing 200 day moving average signals that gold is retaining its overall strength as an asset class for the long term. In addition, the 50 day line is oscillating well above it. This is a somewhat bullish signal for the long term, as the slow momentum is still upwards using moving average analysis.
Overall, weighing all technical data:
Gold is showing immunity to drastic price changes and will likely trade steadily downwards in the near future but should reverse as selling dissipates…
As such, this provides a good opportunity for gold bulls to add to their position in the coming weeks, assuming that the trend can reverse in June.
B: Silver
Fund: iShares Silver Trust (SLV)
The latest hot commodity to hit the market, Silver, has only recently enjoyed the enthusiastic demand that has propelled gold’s price for the last few years. Becoming unstable in late April, it suffered a massive crash– not too dissimilar to its cliff-drop in the 1980’s. Now that the correction is slowing down, can technical indicators point to a reversal, or at least a price floor?
Fundamentally, silver has become popular for many of the same reasons as gold [but] this doesn’t explain why silver performed so spectacularly February, March, and April especially. Simply put, bullish sentiment on the white metal has been through the roof all year. With outlandish estimates by some analysts saying that the metal will be worth $200 [ per ozt.] in a few months, [read this article (5) that has used fractal analysis to forecast that silver is going to $52.80 to $56 dollars before the end of June and this article (6) using Elliott Wave analysis sees the price of silver will reach $52.58 within the same period] it’s easy to see why there were so many buyers. Gold had enjoyed a huge run in the last few years, and it was argued that even though silver had gotten significantly more expensive in 2010, it was still very cheap. While this is true on a gold to silver price ratio [read this article (7) for both a historical perspective on the silver:gold ratio and what it might mean for the future price of silver should gold go parabolic to $3,000, $5,000 or even $10,000 per troy ounce in price in the years ahead] the… [major] rise in its price made a short term correction necessary. Fundamentally, after its nasty correction thus far in May:
Silver is close to where it “should” be and may be within buying range for aggressive traders.
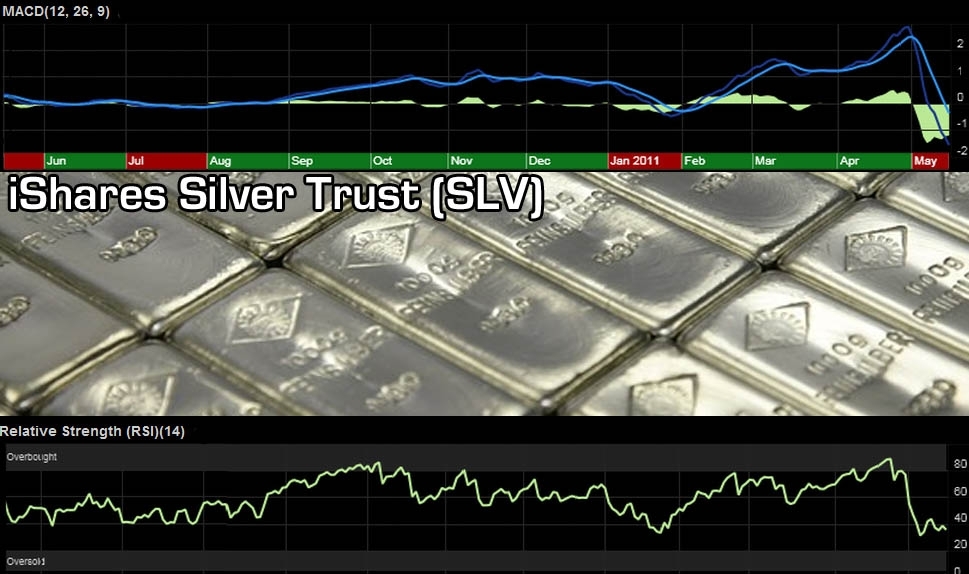
The MACD Trend for Silver
The MACD indicator [as shown above] demonstrates just how drastic silver’s decline was. It’s visible from the big chunk of negative MACD one can see for the entire month of May thus far. The 13 day moving average fell right through the $26, dropping like a rock for two weeks straight. MACD suggests that the acceleration in the price drop of silver may have hit a peak already, but is not over yet. Based on this stochastic:
Silver will remain bearish until MACD returns to positive territory and begins a positive acceleration.
The RSI Momentum for Silver
RSI paints a less drastic picture, but remains bearish in looks. The silver hysteria kept the ETF’s RSI in overbought territory for most of April. In hindsight, this crash was inevitable! The kind of buying momentum propelling silver in April was nothing short of mass hysteria.
The picture will stay bearish until RSI heads into buying territory again, as there has been a complete 180 [degree turn] in the silver market which may take some time to dissipate.
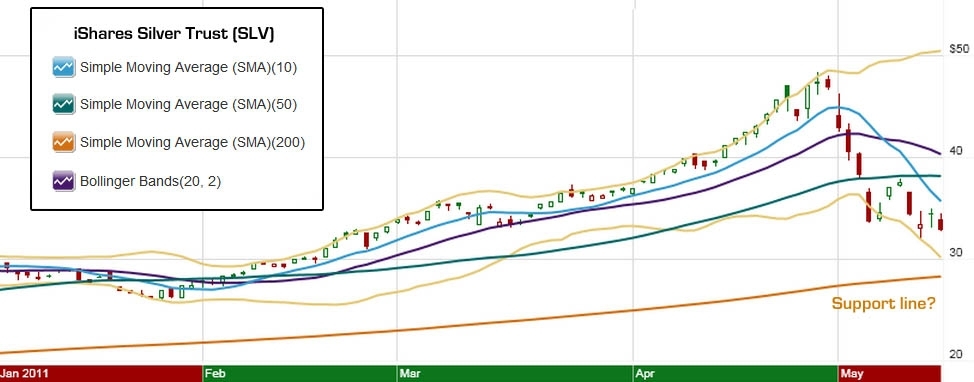
SLV’s chart [above] contains some possible clues as to where (and maybe when) silver may settle. While the 10 day moving average has blown right through the 50-day moving average, the 200-day is slowly drifting upwards. The current selling pressure is as unsustainable as its parabolic rise in April.
If silver does drop all the way to the 200-day average (where it should find support from technical traders), SLV will bottom around $30 a share – assuming a smooth deceleration of the drop. This seems more likely than any other alternative.
[The “Bump and Run Pattern” of technical analysis in this article (8) recently suggested that $33 would be the low for silver while this article (9) by Martin Armstrong suggests that silver might go as low as $23.50 to $26.50 with a yearly support level of $28.]Crude Oil
Fund: US Oil Fund (USO)
Oil has had an interesting year thus far. Mubarak, and later Gaddafi were big drivers in oil’s massive run earlier this year as well as fear of uranium issues. Bearish sentiment on the dollar has also had some impact on oil, as those looking to diversify their inflation hedges chose oil investments alongside the precious metals…
Energy enjoyed the spotlight for the months of February and March. The political uprisings in the Middle East have caused a newfound fear of oil supply shocks, and the Fukushima incident has caused immense amounts of skepticism of the viability of nuclear power. Due to all this and more, oil has increased tremendously in price. Overall, it has been stated many times this year that the oil supply and demand equilibrium never justified the incredibly high $112/bbl that we saw just a few weeks ago. With projections of increasing oil consumption, especially by the BRIC nations, is the current price hovering around $100/bbl going to stay? The short term remains hard to forecast with the volatility of the broader commodities market. This is where technical analysis can be useful.
The MACD Trend for Crude Oil
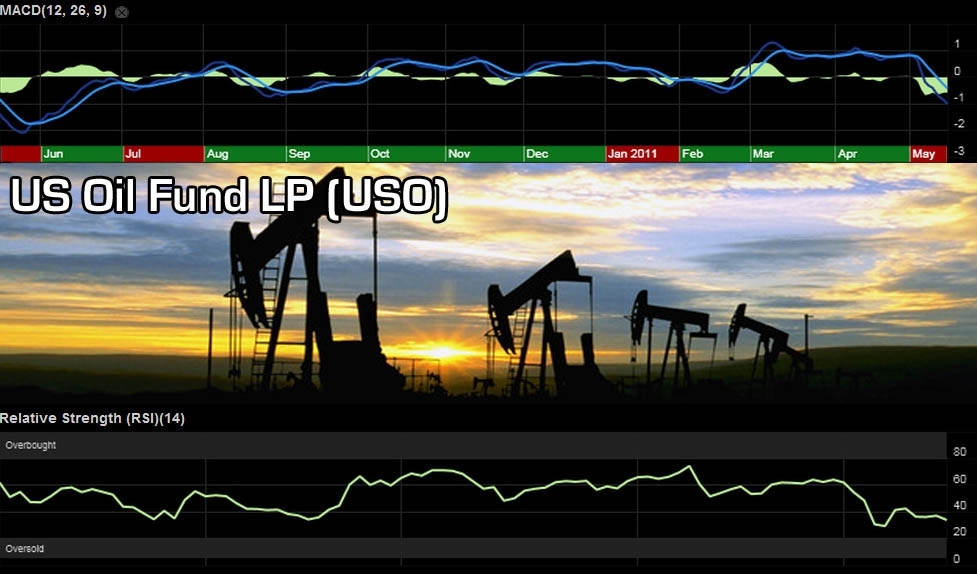
MACD analysis on USO shows a very strong acceleration in the fund’s downtrend. The initial acceleration enjoyed by oil bulls in March (from geopolitical unrest) seems to have finally corrected with the same level of volatility. This indicator points to:
Short and medium term declines for oil until it reverts to zero, similar to silver. The picture, at least for now, is bearish but the decline is unsustainable at this speed.
The RSI Momentum for Crude Oil
RSI indicates that:
Oil is in selling territory, and may remain so for a while as it looks like it may prod even deeper.
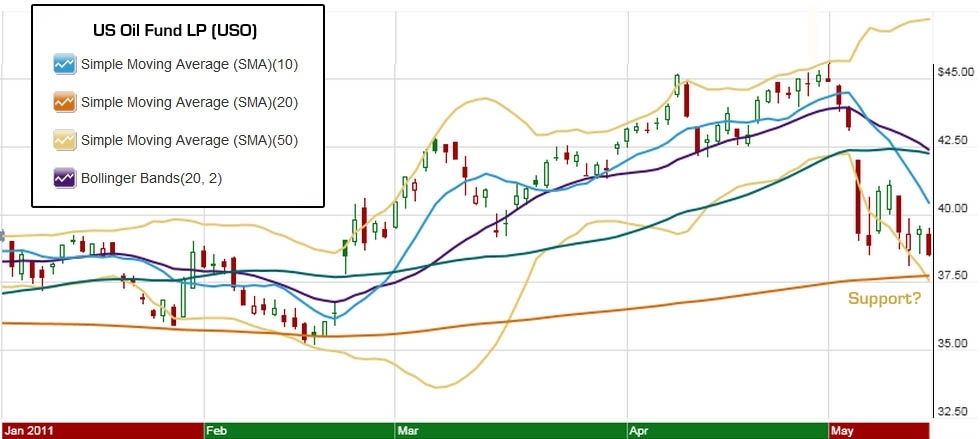
USO’s chart [above] shows just how dramatic the selling in oil assets has been. Based upon modern history, USO has always shown strong support at its 200-day moving average. We will see in the coming days whether this will hold true, as it will be a hard test based on the current momentum. The moving averages are all in decline, with the 10-day blowing through the 50-day in an abnormally steep decline.
If the 200-day moving average holds, the current drop will bottom out close to $37.50. If the price manages to fall through this floor it will likely cause technical traders to consider shorts in the position. With little else to base USO trades on for the time being, psychologically important price levels are crucial to determine direction.
Technicals look bearish on oil for the time being, but watch for a bottom. The selling simply can’t last forever.
Conclusion
Overall, Gold, Silver and Crude Oil show no signs of reversal yet. Those looking to establish commodity positions may want to sit on the sidelines a bit longer.
Links to Articles Referenced Above
- What’s the Difference Between 1 Gold Karat, 1 Diamond Carat and 1 Troy Ounce? https://munknee.com/2011/03/whats-the-difference-between-1-gold-karat-1-diamond-carat-and-1-troy-ounce/
- Yes, You Can Time the Market – Use These Trend Indicators https://munknee.com/2011/05/timing-the-market-using-trend-indicators/
- Ride the Market Waves With These 6 Momentum Indicators https://munknee.com/2011/05/ride-the-market-waves-with-these-6-momentum-indicators/
- Here’s How to Time the Market! https://munknee.com/2011/05/time-the-market-by-using-these-market-strength-and-volatility-indicators/
- Goldrunner: “$52 to $56 Silver by Mid-year” Update https://munknee.com/2011/04/goldrunner-%e2%80%9c52-to-56-silver-by-mid-year%e2%80%9d-update/
- Elliott Wave Analyst Suggests Silver to See $52.58 by Mid -June https://munknee.com/2011/05/elliott-wave-analyst-suggests-silver-to-see-52-58-by-mid-june/
- Why Silver at $398.52 is a Realistic Parabolic Peak Price https://munknee.com/2011/05/silver/
- “Three Peaks” Pattern Suggests Gold to Decline 17% into June! https://munknee.com/2011/05/%e2%80%9cthree-peaks%e2%80%9d-pattern-suggests-gold-to-decline-17-into-june/
- Martin Armstrong Asks: Will Silver Crash in 2011? https://munknee.com/2011/05/martin-armstrong-asks-will-silver-crash-in-2011/
*http://seekingalpha.com/article/270525-what-s-in-store-for-gold-silver-and-oil?source=email_macro_view
Editor’s Note:
- The above article consists of reformatted edited excerpts from the original for the sake of brevity, clarity and to ensure a fast and easy read. The author’s views and conclusions are unaltered.
- Permission to reprint in whole or in part is gladly granted, provided full credit is given as per paragraph 2 above.
Technicals