Higher prices (inflation) are a natural consequence of our ever increasing monetary supply and the U.S. Department of Labor tracks those increases via a basket of common consumer goods which is known as the Consumer Price Index (CPI) but reveals a major discrepancy with The Economist’s Big Mac index. Why is that?
The comments above and below are excerpts from an article by Gregor Gregersen (SilverBullion.com.sg) which has been edited ([ ]) and abridged (…) to provide a fast & easy read.
In 1993, McDonald’s Big Mac hamburgers sold at a bargain of 99 cents in Southern California. Fast forward to 2017 and you will find that Big Macs cost around $5.06 (USD) nowadays – a 411% price increase from 1993.
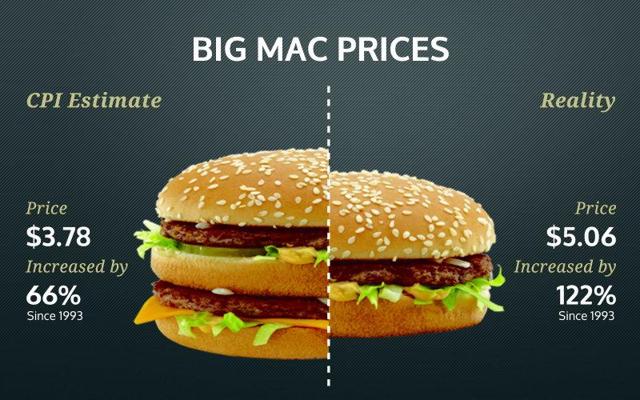
The CPI estimates that average consumer prices between 1993 and 2017 increased by 66%, which would theoretically price today’s Big Macs at around $1.66 rather than the $5.06 it actually costs to buy a Big Mac now.
Further research from The Economist’s Big Mac index showed that Southern California’s 99 cent special was a local anomaly and the average 1993 Big Mac price across the U.S was $2.28. The CPI’s 66% price increase would thereby place Big Macs at a theoretical $3.78 today.
Getting less for your money
The CPI reported a 66% price increase from $2.28 to $3.78 since 1993, actual Big Mac prices surged 122% over the same period.
Undoubtedly, the CPI tracks many products and will not match Big Mac prices exactly. However, Big Macs represent a highly standardized and widely consumed food item making its price changes roughly in line with the CPI.
This CPI vs. Big Mac discrepancy is just an example to highlight how the real cost of living seems to be consistently increasing at a faster rate than the CPI. Over time, it is becoming harder to make ends meet if your income is CPI adjusted, hence the question:
Is the CPI understating price increases in the real world ?
A look into how the CPI is calculated will reveal that the CPI goods definition has been routinely modified since the 1990s resulting in lower reported price increases. This is why the CPI is often described to represent an “adjustable” basket of commonly purchased goods. The most common adjustments include:
- Substitution adjustments: Here, goods that are increasing in prices are replaced by cheaper substitutes. So if beef prices increased faster than chicken, the CPI will be adjusted to contain less beef and more of the cheaper chicken meat, thereby lowering reported inflation.
- Quality adjustments: Here, certain goods in the index are deemed to have become of a higher quality, so their prices are adjusted downward to “price compensate” for the quality increase.
The rationale for these adjustments is that higher beef prices (or Big Macs?) would eventually cause consumers to buy less beef. This argument is used by the Bureau of Labor Statistics to re-adjust the CPI basket periodically to contain a disproportionately large number of lower priced goods.
Ultimately, these CPI adjustments put in question the very purpose of the original CPI concept which was to track prices for a fixed basket of goods over time. The CPI adjustments also explain why there is such a widening gap between CPI numbers and real (e.g. Big Mac) prices at the store. For more on the topic please visit shadowstats.com.
These CPI adjustments mean that the purchasing power of CPI linked pension plans and payouts will keep falling over time because prices of real goods will be increasing at a faster rate than the CPI. The value of the accumulated fiat savings will therefore also depreciate at a faster rate than the CPI indicates.
Currency – Depreciation with Interest
The Dollar, Euro, Yen and other currencies are constantly depreciating as more currency is created to pay interest, fund increasing debts, keep money cheap and occasionally bail financial institutions. All those who save in fiat currencies are therefore stuck in a struggle to generate enough returns to make up for the falling value of their Dollars, Euro or Yen.
Fiat savers that fail to earn returns above the inflation rate – which is likely higher than what the CPI indicates – will therefore slowly have their real wealth eroded away.
For example, a $100 bill in 1913 would have represented a typical U.S. monthly wage and would have had a spending power equivalence of at least $2,500 in 2017 dollars. Based on the U.S. government’s own CPI numbers, the USD of today has lost 96% of its value since then.
Another way to look at it is that every year the real value of the $100 note diminished by an average 3.2% so, if your grandfather would have stuffed a $100 bill under his bed for you in 1913, you would have needed to earn an average interest of at least 3.2% just to break even over the next 103 years. The longer the wait, the more the $100 would have eroded in value. Even if the $100 had achieved a 2% return per year, its value would only be $770 today – well below the breakeven point of $2,500. Therefore, saving 2% in a currency that depreciates at an average of 3.2% per year is a 1.2% loss in real terms. It is inevitable that saving in currencies will come with the associated risks from depreciation.
Gold and Silver – Appreciation Without Interest
On the other hand, if your grandfather had stuffed $100 worth of gold under his bed, it would have been a tidy 4.84 [troy ounces]…of gold which would have been worth about $6,000 today. This would be an increase in purchasing power (using CPI) of 240% since 1913 so, while currencies depreciated away, gold rose on average by 4% per year in USD terms over 103 years (1913 to 2016) from $20.68 to around $1,250 per troy oz.
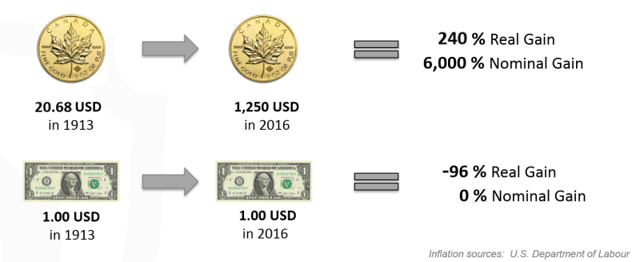
The appreciation of gold’s value easily surpassed the USD’s average loss of 3.2%, leaving you with a long term average real gain (assuming CPI inflation) of around 0.8% p.a. in USD terms as summarized here:
- Since 1913 gold gained about 4% in USD terms each year.
- Since 1913 the USD lost about 3.2% of it’s purchasing power each year.
- Since 1913 gold gained about 0.8% in real purchasing power.
Note that these numbers are based on a sample $1,250 gold price per troy oz. Assuming a $1,895 gold price (its nominal high back in September 2011), the yearly return would have been around 4.5% pa, while gold at $1,050 would have resulted in an approximate 3.9% yearly return since 1913 so, over the last century, gold’s return showed an average 3.9% to 4.5% return in USD terms while the USD had an average 3.2% loss in real terms. Thus, saving in gold for the long term is simple: buy, hold and allow it to appreciate over time.
Printing more currency eventually means higher gold & silver prices
A fundamental reason for the long term appreciation of gold and silver prices is that its physical supply grows at a much lower rate compared to fiat currencies which are created as needed.
For example, over the last 10 years:
- The U.S. monetary base grew by over 450%.
- Gold mining increased gold holdings by around 13%.
- Worldwide silver reserves actually diminished.
Conclusion
Given how much fiat currency has been created over the past decade and given that gold and silver are trading at a 35% and 65% discount respectively (see the Gold/Silver Ratio) from their 2011 highs it is just a matter of time for some of this currency to flow into precious metals.