Do you really need portfolio diversification?…Everyone assumes that broad asset class portfolio diversification is advantageous…[as it] reduces the risk associated with events that can trigger a decline in any one asset class…[and makes] financial planning more reliable and predictable by reducing the variations in portfolio performance from year to year. Simply put, portfolio diversification is a sound investment practice but, [that said,] exactly how much risk reduction, in actual numbers, is obtained through application of this philosophy? [Bottom line, is] asset class diversification all that it’s cracked up to be? This article…addresses…the benefits of diversification among various classes.
The original article has been edited here for length (…) and clarity ([ ]) by munKNEE.com – A Site For Sore Eyes & Inquisitive Minds – to provide a fast & easy read.
Setup
The ideal tool for performing the analysis in this article is Modern Portfolio Theory (MPT). This Nobel Prize-winning approach utilizes complex mathematics to tell you how to best allocate your funds among various asset classes to minimize risk.
Risk can be looked at as fluctuations in portfolio returns. In MPT, risk is measured by a statistical term called the standard deviation. It is this quantity that MPT seeks to minimize in recommending portfolio diversification allocations. (The software used in the analyses conducted here is the SMC Analyzer. Click here for more info.)
The portfolios considered here used monthly total return data taken from January 1928 through Dec 2017 for each of the following 10 asset classes:
- Large-Cap U.S. Stocks
- Small U.S. Stocks
- Long-Term Corporate Bonds
- Long-Term Government Bonds
- Intermediate-Term Government Bonds
- 30-day U.S. Treasury Bills
- Real Estate Investment Trusts (REITs)
- International Stocks
- International Bonds
- Gold
Each of these asset classes are themselves composed of a broad diversification of assets within that class. This article does not address that need, only the benefits of diversification among various classes.
Baseline
The methodology used in this analysis was to first establish a baseline return/risk table using all 10 candidate asset classes (Table 1 below). You’ll see that the table contains certain measures of risk defined as follows:
- Standard Deviation – statistical measure of portfolio return fluctuation around the target return.
- Probability of Loss – chance of that portfolio losing value in any one year.
- Sharpe Ratio – a measure of risk versus reward with larger numbers being better.
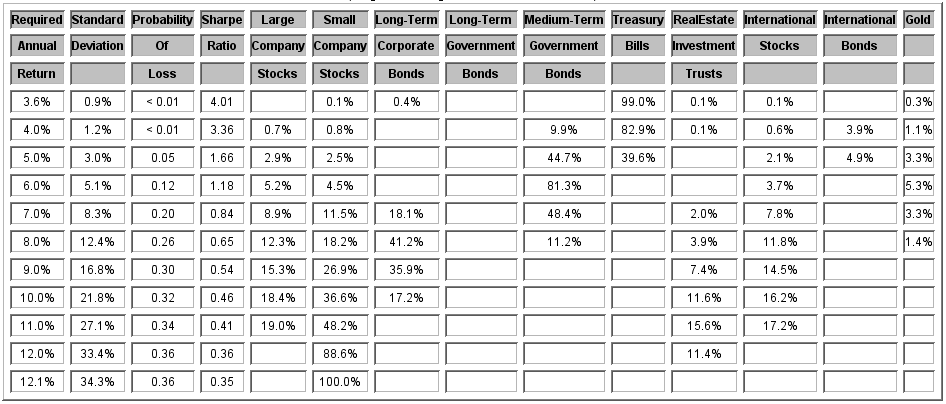
This baseline data is shown in Table 1 along with the current ten asset class portfolio allocations (through May 2011.)
Table 1. Baseline portfolio incorporating all ten candidate asset classes.
Methodology
The next step was to remove each asset class one by one in each of successive rounds and to assess its effect on the measures of risk. At the end of each round we chose to eliminate that asset class that increased the measures of risk the most. This was repeated for eight rounds until only two asset classes remained. Eliminations required examination of 52 separate portfolios (10+9+8+7+6+5+4+3).
By using the above measures of risk as our benchmark, asset classes were eliminated from consideration in each successive round in the following order:
- International Bonds
- Long-Term Government Bonds
- Real Estate Investment Trusts
- Gold
- International Stocks
- 30-day U.S. Treasury Bills
- Large U.S. Stocks
- Either Intermediate-Term Government Bonds or Long-Term Corporate Bonds depending on target return
Results
Tables 2a and 2b show the measures of risk using only two asset classes in the MPT analysis. There are two tables because different asset class combinations are preferable for the most conservative portfolios (target returns up to and including 7%) and the more aggressive ones (target returns 8% and above).
Table 2a. Two asset class allocations and risk measures for conservative portfolios
| Required | Standard | Probability | Sharpe | Small | Medium-Term |
|---|---|---|---|---|---|
| Annual | Deviation | Of | Ratio | Company | Government |
| Return | Loss | Stocks | Bonds | ||
| 5.5% | 4.6% | 0.12 | 1.19 | 1.8% | 98.2% |
| 6.0% | 5.3% | 0.13 | 1.14 | 10.1% | 89.9% |
| 7.0% | 8.7% | 0.21 | 0.81 | 25.0% | 75.0% |
Table 2b. Two asset class allocations and risk measures for more aggressive portfolios
| Required | Standard | Probability | Sharpe | Small | Long-Term |
|---|---|---|---|---|---|
| Annual | Deviation | Of | Ratio | Company | Corporate |
| Return | Loss | Stocks | Bonds | ||
| 8.0% | 12.8% | 0.27 | 0.62 | 34.3% | 65.7% |
| 9.0% | 17.3% | 0.30 | 0.52 | 50.4% | 49.6% |
| 10.0% | 22.4% | 0.33 | 0.45 | 66.3% | 33.7% |
| 11.0% | 27.8% | 0.35 | 0.40 | 82.1% | 17.9% |
| 12.0% | 33.6% | 0.36 | 0.36 | 97.8% | 2.2% |
| 12.1% | 34.4% | 0.36 | 0.35 | 100.0% |
You can see from the tables above that returns are best realized by small-cap stocks and medium-term government bonds in conservative portfolios, and by small-cap stocks and long-term corporate bonds (investment grade) in the more aggressive ones. The inclusion of small-cap stocks especially in the more aggressive portfolios should come as no surprise because it is this asset class that is capable of generating the highest returns over the long haul. In fact, it is because of using only small-cap stocks to generate returns in the two candidate model that returns below 5.5% are completely unachievable (but so are very low levels of risk).
Now let’s see how these results compare to the classical model of using 10 asset classes.
Comparison of results
Table 3 presents the risk differences associated with reducing ten asset classes to only two.
Table 3. Risk difference between two and ten asset classes
| Required | Standard | Probability | Sharpe |
|---|---|---|---|
| Annual | Deviation | Of | Ratio |
| Return | Loss | ||
| 6.0% | 0.2% | 0.01 | -0.04 |
| 7.0% | 0.4% | 0.01 | -0.03 |
| 8.0% | 0.4% | 0.01 | -0.03 |
| 9.0% | 0.5% | 0.00 | -0.02 |
| 10.0% | 0.6% | 0.01 | -0.01 |
| 11.0% | 0.7% | 0.01 | -0.01 |
| 12.0% | 0.2% | 0.00 | 0.00 |
Discussion
What this analysis shows is truly astonishing and surprising. You can see that the reduction in the number of asset classes has a relatively insignificant effect on risk. I’m betting few folks would have expected this result!
To summarize all this into one number, you are increasing your overall level of portfolio risk by only about 1 part in 20 by decreasing the number of candidate asset classes from ten all the way down to two. This is based on the general numerical increase in the values of the risk measures as measured from their baselines.
An historical comparison
Looking at this from a historical perspective, let’s see how well a portfolio with only two asset classes would have fared against a traditional portfolio with all ten. Table 4 shows the results of actually following the recommended MPT allocations – with monthly rebalancing – from January of 1928 through May of 2011.
Table 4. Comparison of actual returns achieved utilizing ten asset classes versus two asset classes.
| Required | Ten Asset Classes | Two Asset Classes | Differences | |||
|---|---|---|---|---|---|---|
| Return | Return | SD | Return | SD | Return | SD |
| 6.0% | 7.1% | 7.3% | 8.0% | 8.9% | 0.9% | 1.6% |
| 7.0% | 8.2% | 10.1% | 9.1% | 11.1% | 0.9% | 1.0% |
| 8.0% | 8.6% | 12.6% | 10.2% | 13.5% | 1.6% | 0.9% |
| 9.0% | 9.1% | 14.5% | 10.9% | 15.7% | 1.8% | 1.2% |
| 10.0% | 10.1% | 16.7% | 11.4% | 17.6% | 1.3% | 0.9% |
| 11.0% | 10.9% | 18.8% | 11.7% | 19.2% | 0.8% | 0.4% |
| 12.0% | 11.8% | 19.9% | 11.8% | 20.5% | 0.0% | 0.6% |
To read this table, the Return under each model is the actual return the portfolio would have realized at the required return level given in the first column, and SD is the risk defined by the standard deviation.
Let’s look at an example. To achieve a 10% required compounded average annual return, a 10-candidate asset class portfolio would have achieved its goal and would have actually returned 10.1% at a risk of 16.7%. That same 10% targeted return attempted using only two asset classes would have actually produced a greater return, 11.4%, with only a slightly higher standard deviation of 17.6%.
It is interesting to note that the portfolios composed of only two asset classes exceeded their targets more so than their ten asset class counterparts. This is due to the fewer choices available to the mathematics of MPT in its attempts to achieve, at least, the required return while also minimizing the level of risk but, in so doing, the level of resultant risk is commensurately slightly higher.
Conclusion
The takeaway from this article should be to note that it doesn’t take broad asset class diversification to adequately achieve one’s investment goals with a reasonable level of reward versus risk…You can sleep easier knowing that your nest egg needn’t be diversified among more than the two carefully selected asset classes discussed above for you to realize your desired long-term return at minimum risk…
Related Articles From the munKNEE Vault:
1. Your Portfolio: What IS & IS NOT Effective Diversification
Investors are paying more and more attention to how certain strategies, asset classes or investments perform over shorter and shorter time frames, constantly looking for the best or worst performing sector/smart beta style/ETF/hedge fund/portfolio strategy during the latest two day or even two month sell-off or rebound. That’s not how you build a long-lasting portfolio. This article discusses some of the misconceptions about diversification.
2. Poor Portfolio “Diversification” Can Kill Your Portfolio Returns – Here’s Why
Most investors don’t know anything more about diversification than you “shouldn’t put all your eggs in one basket” [but] spending some time trying to understand the ways you might be shooting yourself in the foot could seriously enhance your portfolio returns and stop catastrophic risk. There are some advantages to diversification if you REALLY know what you are doing but the shortcomings can go a long way towards killing your portfolio returns. In this article we identify what they are and how best to avoid them.
3. Bonds May Not Provide Portfolio Diversification Investors Usually Rely On – Here’s Why
While it is unclear what impact the next few interest rate hikes will have on the real economy the long term impact is a different story. A more active Fed may have an enormous impact on how investors build portfolios, a development we contemplate in this article.
4. Apply the Bell Curve to Your Portfolio Asset Diversification – Here’s Why
80% of my investable income is in cash, precious metals and a small number of stocks. That might seem crazy, but the Pareto Principle, Zipf’s Law and the bell curve have convinced me that it’s a waste of time and money to get any more diversified. Let me explain why that is the case.
5. Attn. Financial Advisors: How Much Asset Class Diversification Is Really Necessary?
No one would argue that diversification is not a sound investment practice but exactly how much risk reduction, in actual numbers, is obtained through application of this philosophy? This analysis is an attempt to quantitatively determine its relevance – and you will be surprised by the answer. Read on!
6. Is Precious Metals Stock Volatility Worth the Diversification Benefit To Your Portfolio?
Natural resource stocks could make for a nice diversifier in a portfolio but I wonder how many investors have the intestinal fortitude to take advantage of that diversification. That’s the question investors need to answer before diving in.
7. Warren Buffett’s Advice Is NOT for the Average Investor! Here’s Why
Warren Buffett is a smart guy and has ascended to near immortal [status] amongst the investment community due to his superior stock picking skills and boundless wealth. That being said, listening to his views on portfolio management and diversification could cripple your financial health and may make him one of the most dangerous men in finance. Let me explain.
8. Warren Buffett: Diversification is Nothing More Than Protection Against Ignorance
NOT putting all your eggs in one basket makes intuitive sense to many investors. Indeed, evidence indicates that putting more eggs in your basket may actually crack your portfolio, not protect it.
For all the latest – and best – financial articles sign up (in the top right corner) for your free bi-weekly Market Intelligence Report newsletter (see sample here) or visit our Facebook page.